About the Trading Diary
The Purpose of the Diary
It is difficult to absorb knowledge from training courses in such a short space of time. The Trading Diary supplements this knowledge, providing readers with continuous exposure and the opportunity to apply their acquired knowledge, reinforcing sound technical analysis and trading principles.
Not Investment Advice
The Trading Diary is intended to illustrate the techniques used in technical analysis and trading; and should not be interpreted as investment advice. Please read the Disclaimer.
Market Strategy
For details of my trading philosophy, see My Strategy.
Conclusions for an index are the overall strategy relating to that market. This does not mean that every sector of the market should be treated in the same fashion. There may be some sectors which trend in the opposite direction to the general market. If the overall strategy is short, there may still be opportunities to go long in some sectors that trend counter to the general market.
Analysis Tools
Market analysis is conducted using:
- Trend channels to highlight primary and intermediate trends;
- Classic Dow theory;
- Support and resistance levels;
- Chart patterns;
- Price-volume relationships;
- Reversal days, gaps and candlesticks.
Twiggs® Money Flow, Volume Oscillator, Moving Average and MACD indicators are used to highlight some of these changes.
Time Frames
Time frames are divided into short, medium (intermediate) and long:
- Short term = 1 day to 3 weeks
- Intermediate = 2 weeks to 3 months
- Long = 2 months to 3 years
This is only a rough guide, as can be seen from the overlap.
Market Stages
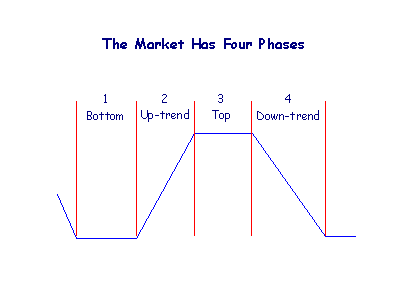
There are four possible stages/phases:

- Base or bottom
The market ranges between support and resistance, after a stage 4 down-trend. The index normally whipsaws around long-term moving averages and there may be clear signs of accumulation, including declining volume on downward movements and increasing volume on rallies. - Primary up-trend
Stage 2 up-trends follow a breakout from stage 1. The index respects long-term moving averages (from above) and there should be strong volume on rallies and light volume on corrections. - Top
The market levels off into a trading range after a stage 2 up-trend. The index normally whipsaws around long-term moving averages, with greater volatility than stage 1. A stage 3 top normally continues to show high volume as the market repeatedly attempts to overcome resistance. A dry-up of volume may signal that the trading range will breakout on the upside, reverting back to a stage 2 up-trend. - Primary down-trend
A stage 4 down-trend follows a break below a stage 3 top. The index respects long-term moving averages (from below), with strong volume on declines and light volume on upward corrections.
Sometimes the market forms a chart pattern, such as a descending or ascending triangle, in place of a rectangular trading range in stages 1 or 3.
