Link for this issue: https://tradingdiary.incrediblecharts.com/2024-09-17_whats_new.php
New Stock Screen Filters
In response to requests and feedback, we have added
 filters for:
- Twiggs Trend Index
- Above/Below Zero - Additional Time Periods Added
- Value Filter
- Twiggs Momentum Smoothed
- Above/Below Zero
- Value
- Trailing Stops
- Average True Range - Additional Multipliers Added

Premium Data: Save 50% for the first two months
- Stock charts for ASX, NYSE, NASDAQ, TSX and LSE
- Amazing insight from 100+ technical indicators including proprietary Twiggs® Money Flow & Momentum oscillators
- Powerful new stock screens
- New subscriptions only. No Lock-in contracts.
New filters:
Twiggs Trend Index
Twiggs Trend Index is a proprietary indicator that reflects market sentiment, highlighting accumulation in uptrends and distribution in downtrends.
Value Filter
The Value filter identifies strong accumulation or distribution by testing for Minimum or Maximum values, respectively.

The chart below shows how Hub24 (HUB) commenced a strong uptrend after Twiggs Trend Index crossed above 0.2, signaling strong accumulation.
Above/Below Zero
We added additional Time Periods to the Above/Below Zero filter including 50, 100 and 200 Day Periods, to identify long-term accumulation or distribution.

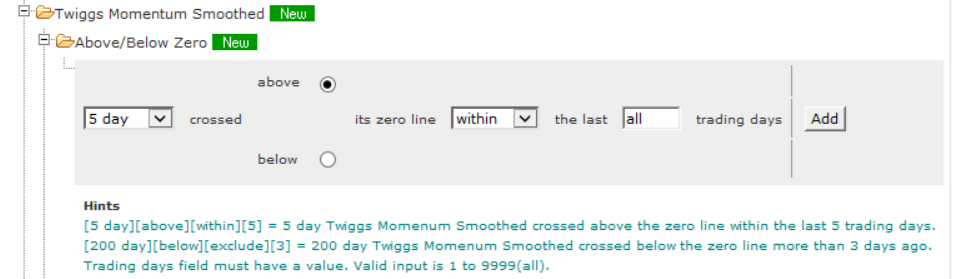
Twiggs Momentum Smoothed
We added new filters for Twiggs Momentum Smoothed.
Twiggs Smoothed Momentum is a smoothed version of the proprietary Twiggs Momentum oscillator. It aims to provide a slower, less erratic signal for following long-term trends.
Above/Below Zero
Twiggs Momentum Smoothed crosses above/below zero.
Value
Twiggs Momentum Smoothed Value filter.

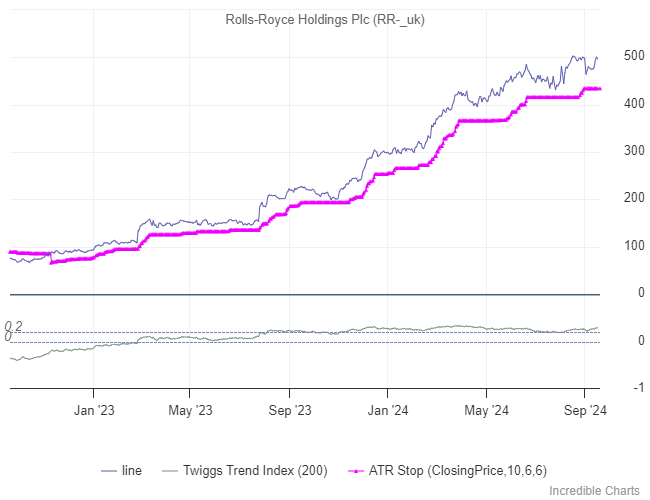
Trailing Stops
We also added additional multipliers for ATR Trailing Stops. These are useful for tracking long-term trends, like Rolls-Royce Plc (RR-) below.
We hope that you find the changes useful. We are constrained by the number of filters we can add but will welcome further feedback or suggestions.
Regards,
The Incredible Charts Team
Everything contained in these newsletters, related websites, training videos and training courses (collectively referred to as the "Material") has been written for the purpose of teaching analysis, trading and investment techniques. The Material neither purports to be, nor is it intended to be, advice to trade or to invest in any financial instrument, or class of financial instruments, or to use any particular methods of trading or investing.
Advice in the Material is provided for the general information of readers and viewers (collectively referred to as "Readers") and does not have regard to any particular person's investment objectives, financial situation or needs. Accordingly, no Reader should act on the basis of any information in the Material without properly considering its applicability to their financial circumstances. If not properly qualified to do this for themselves, Readers should seek professional advice.
Investing and trading involves risk of loss. Past results are not necessarily indicative of future results.
You, the Reader, need to conduct your own research and decide whether to invest or trade. The decision is yours alone. We expressly disavow all and any liability to any person, with respect of anything, and of the consequences of anything, done or omitted to be done by any such person in reliance upon the whole or any part of the Material.
Archive
To access past What's New updates, go to the Trading Diary Archive and use the drop-down to filter the list.
Give me six hours to chop down a tree and I will spend the first four sharpening the axe.
~ Abraham Lincoln