False Breaks: the Fakeout
Tricks of the Trade
If a market professional sits with a large sell order and the stock is consolidating (a sign that the market is in equilibrium) he knows that he cannot merely dump his orders on the market. That would upset that equilibrium and he would be selling into a weak market, chasing prices down. The golden rule is: sell into strength, so our trader bides his time and waits for the market to test resistance at the top of the range. If impatient, he may even help to nudge prices across the line with a few well-timed buy orders.
As soon as price crosses the line there is a tremor of excitement. Conditional buy orders placed in anticipation of a breakout are triggered. Traders watching their screens notice the activity and send in a flood of new buy orders; everyone hopes to get on board before price rallies too far above the former resistance levels. And who is standing in the face of the rally, happy to accommodate them? Our market professional releases a steady stream of sell-orders into the market, careful not to saturate the market until he has offloaded most of his stock.
Other professionals pick up on what is happening and start shorting the stock. The rally fizzles and the punters are left high and dry. Price retreats back below the new support level (formerly resistance) and triggers their stops. A fresh round of selling ensues as the punters struggle to clear their positions. The professionals cover their short positions and go home having made a tidy profit for a few hours work. It's a hard game -- you have to live by your wits -- but the rewards are big.
Our market professional reports back to his clients that he has offloaded the large parcel of stock at well above the average price traded over the past few days. They congratulate themselves and are happy to pay his fat commission -- he has earned it.
Example
Westpac Banking Corporation on the ASX had started to rally in early 2003 after a broad double-bottom and a shakeout below $13.00. The stock entered a narrow consolidation, with low volume for the three days starting at [2]. A shakeout follows at [3]:
- a break through resistance;
- the rally meets with strong selling;
- price is driven back below the resistance level;
- all in the same day.
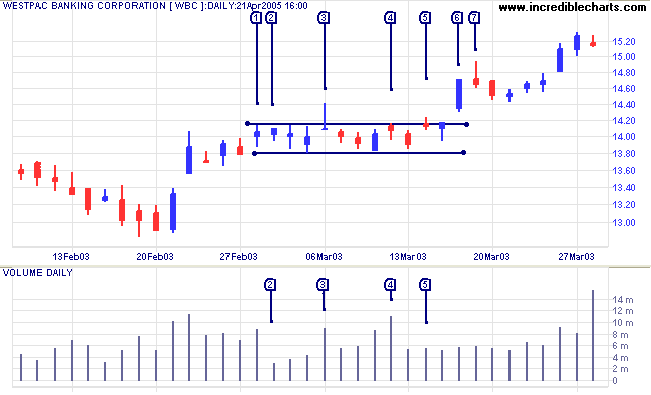
Punters are more cautious the second time at [5], with a narrow price range and lower volumes. Then we have a real breakout at [6], with a gap above the resistance line and a strong blue bar on average volume. The rally meets further selling at [7] before it continues on its' way.
Variations
Most false breaks expire on the same day but you do get larger patterns that occur over a week or more. These false breaks occur in a larger time frame. Broad patterns, encompassing a false break above a primary resistance level, are the most powerful and often forewarn of a primary trend reversal.

Author: Colin Twiggs is a former investment banker with almost 40 years of experience in financial markets. He co-founded Incredible Charts and writes the popular Trading Diary and Patient Investor newsletters.
Using a top-down approach, Colin identifies key macro trends in the global economy before evaluating selected opportunities using a combination of fundamental and technical analysis.
Focusing on interest rates and financial market liquidity as primary drivers of the economic cycle, he warned of the 2008/2009 and 2020 bear markets well ahead of actual events.
He founded PVT Capital (AFSL No. 546090) in May 2023, which offers investment strategy and advice to wholesale clients.