Point and Figure Charting Guide
- Charting guide
- Log or Normal scale?
- Box sizes and reversal amounts
- Selecting appropriate box and reversal sizes
- High/Low, Closing or Typical Price
- Setup
Charting Guide
Point and Figure charts can be a great time saver, conveniently summarizing
trends and eliminating most short-term market "noise". They also
highlight major support and resistance levels.
Basics are explained at the
Trading
Guide: Point & Figure Charts.
The All Ordinaries [XAO] chart below gives a clear summary of major trend movements:
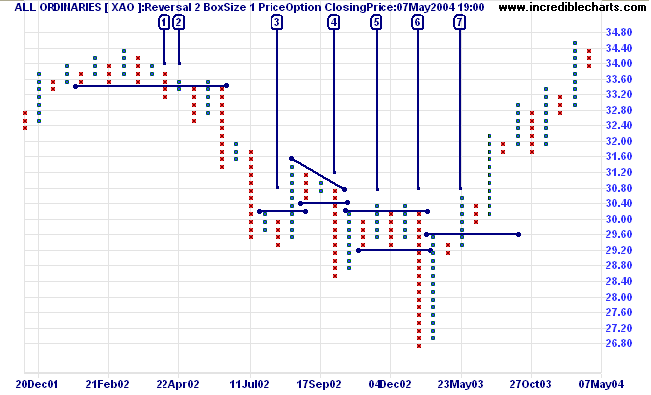
- A down-trend starts at [1], with a break below support at3340.
Note the earlier 3 upswings could only achieve marginal breaks above previous highs, warning of a stage 3 top. - Marginal breaks at [2], above the new resistance level, are a further bear signal: confirming the down-trend.
- At [3] we have a marginal break below the previous low which forewarned of a strong bear market rally.
- A bear signal with a break through support at [4].
- Marginal breaks [5] above resistance (similar to 2. above) - another bear signal.
- The break through support (2920) at [6] turns into a downward spike.
- The rise above 2960 at [7] signals the start of the current up-trend.
When used in conjunction with shorter-term indicators the charts can be a powerful tool. There is more on pattern identification at the Trading Guide: Point & Figure Chart Patterns.
Log or Normal Scale?
While log scale charts are useful because of the graduated increase in box sizes, I find the odd-numbered box sizes a distraction. Major support and resistance levels normally occur at round numbers (especially with individual stocks rather than indices) which are not clearly identified on log scale charts.
Normal box sizes are themselves stepped at regular intervals, to cope with varying price scales: stocks with prices of $20.00 and 20 cents cannot be charted with the same box size. The steps below are for a box size of 1. If you want box sizes of a dollar for a stock price of $20.00, select box size: 5.
| Price | Box Size | |
| From: | Dollars ($) | Cents (c) |
| $ 0.00 |
0.1 |
|
|
$ 0.20 |
0.2 |
|
|
$ 0.50 |
0.5 |
|
|
$ 1.00 |
1 |
|
|
$ 2.00 |
2 |
|
|
$ 5.00 |
5 |
|
|
$ 10.00 |
10 |
|
|
$ 20.00 |
20 |
|
|
$ 50.00 |
50 |
|
|
$ 100 |
1.00 |
100 |
|
$ 200 |
2.00 |
|
|
$ 500 |
5.00 |
|
|
$ 1000 |
10.00 |
|
Box sizes and reversal amounts
There is no single box setting that is suitable for all purposes. When selecting box sizes and reversal settings, there are two main considerations :
- The time frame:
When viewing longer time frames, for intermediate or primary trends, you will need to eliminate shorter-term fluctuations. Day traders or swing traders, on the other hand, will want to see short-term rallies and corrections. - The purpose:
Are you going to trade from the signals or merely use point and figure as a trend indicator?
You need to achieve a balance between reliability and responsiveness:
- Large box sizes provide very reliable signals but often late, leaving profits on the table:
| Buy/Sell Signals | |
| Buy [b]: | When a column of Xs rises above the preceding column of Xs |
| Sell [s]: | When a column of Os falls below the preceding column of Os |
- Smaller box sizes provide earlier signals but will also deliver more false signals:
Which is where reversal settings come in, allowing us to keep box sizes relatively small while, at the same time, eliminating minor fluctuations. A new column is not started until the trend has completed a set number of boxes (normally 2 or 3).
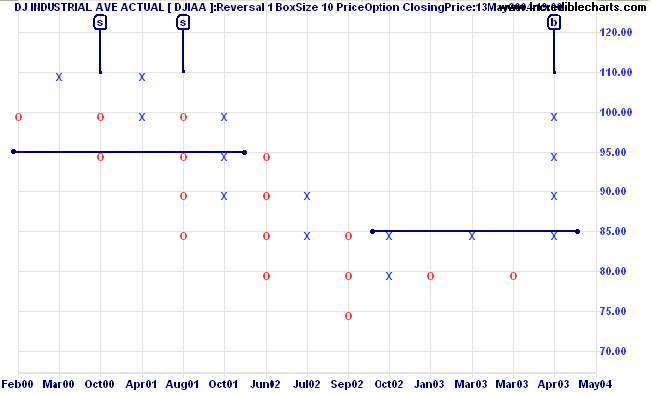
Observe where the major support/resistance levels have formed on the Dow Jones index chart: at the round numbers of 7500, 8000, 9000 and 10000. This reinforces my earlier point about normal vs. log scales.
Selecting appropriate box and reversal sizes
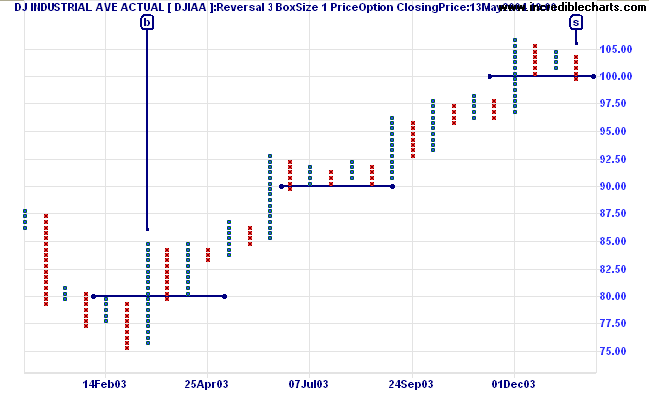
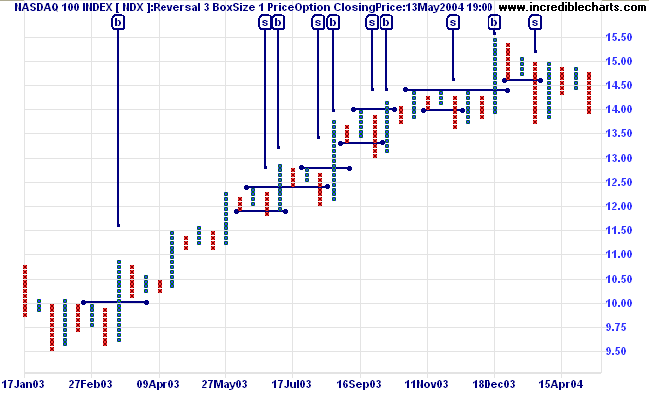
Not all securities (nor indices) have the same volatility. What is an appropriate setting for the Dow Jones index (above), may not be suitable for the more volatile Nasdaq 100 index [NDX] below:
I am not aware of any method of automatically adjusting box
sizes to cope with increased volatility.
The basic principles for manually selecting appropriate box
and reversal sizes are:
- Keep the reversal amount at a constant 2 or 3.
I prefer a reversal amount of 2, Thomas Dorsey Point And Figure Charting (Wiley, 1985) uses 3. - The practical maximum reversal amount is about 5. This should only be used for long-term charting (e.g. 5 years or more).
- Increase box sixes to cope with more volatile stocks or indices.
- Aim to minimize false signals, rather than to eliminate them altogether.
You have two options for selecting appropriate box/reversal settings:
-
Select the best visual fit based on the chart history.
Use the P&F selector arrow on the toolbar as a shortcut to select saved point and figure settings.
 - Use the Volatility index.
For example, using Volatility index (1000-Day with exponential MA of 500) we can derive a table (for long-term use) where box sizes are increased by 1 for each 5% increment in volatility:
Stock/Index Volatility index Volatility range number of boxes Box size Reersal amount All Ordinaries [XAO] 5.5% 5 - 10% 2 1 2 Dow Jones [DJIAA] 10% 10 - 15% 2 1 2 S&P 500 [SPX] 16% 15 - 20% 4 2 2 Nasdaq 100 [NDX] 49% 40 - 50% 10 5 2 Yahoo [YHOO] 97% 90 - 100% 20 10 2
The table should be used only as a guideline. It is advisable to visually assess whether the settings are a good fit.
High/Low, Closing or Typical Price
There is a detailed explanation of the three pricing methods at Point & Figure, but here is a brief summary:
- The High/Low method plots highs in an up-trend and lows in a down-trend;
- Closing Price method plots only changes in closing price;
- Typical Price averages High, Low and Closing Price.
High/Low
The High/Low method attempts to approximate the early DeVilliers method of point and figure charting which used intra-day data. By using highs in an up-trend and lows in a down-trend the method is more responsive to trend changes. It is suited to short-term point and figure charts: there are too many false signals for long-term charting.
Example
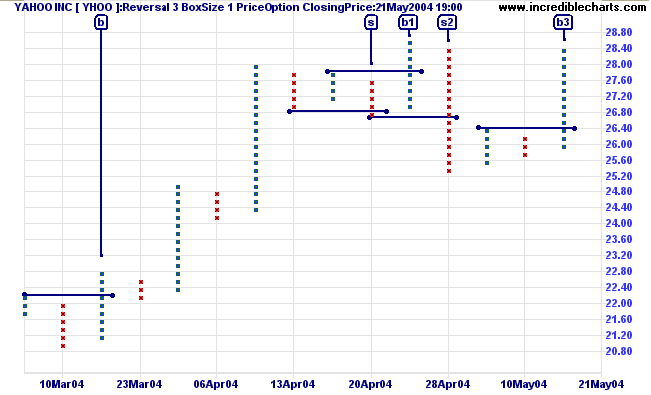
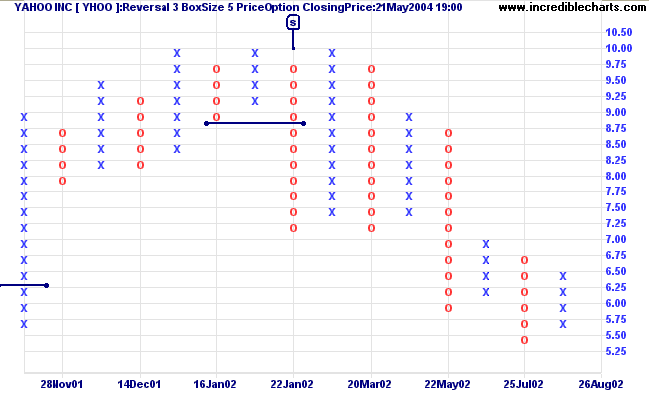
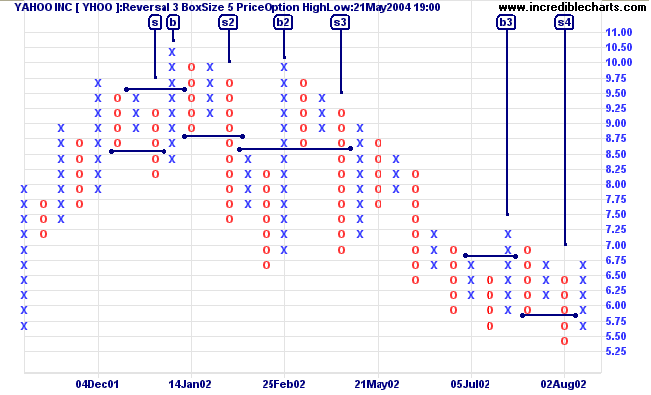
Compare the High/Low and Closing Price methods with Yahoo Inc [YHOO]:
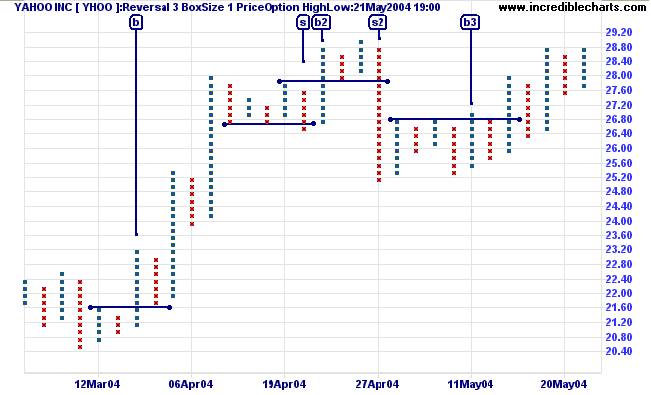
Generally, High/Low signals are earlier. The biggest difference on the above charts is signal [s2]: the High/Low sell signal is at $27.80, compared to $26.60 with the Closing Price method (below).
| Buy/Sell Signals | |
| Buy [b]: | When a column of Xs rises above the preceding column of Xs |
| Sell [s]: | When a column of Os falls below the preceding column of Os |
Closing Price
Closing price is more suited to longer-term charts; eliminating false signals caused by intra-day fluctuations.
Example
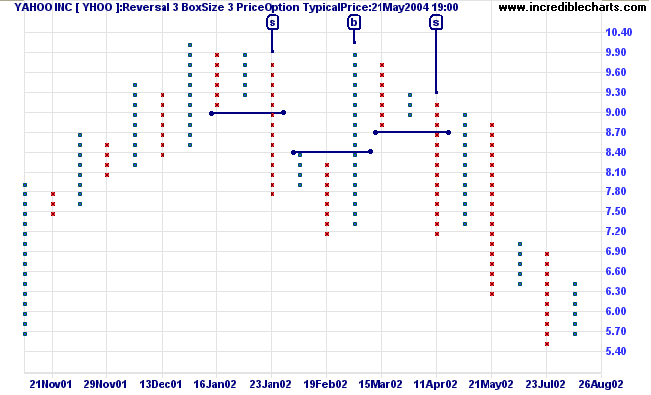
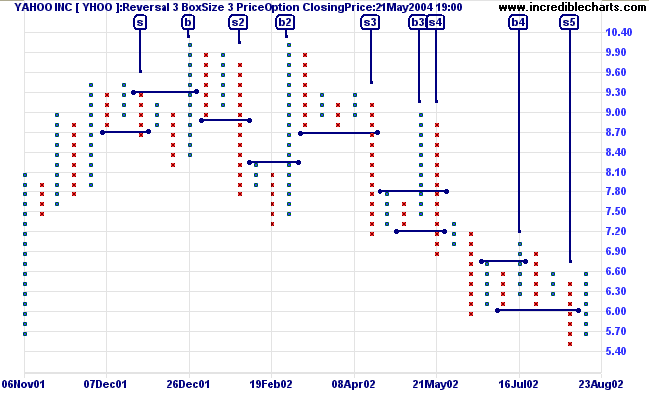
This time we take a 5-year chart of Yahoo Inc [YHOO], with a box size of 5 and reversal of 3, and zoom in on the top at the end of 2002:
You can see that Closing Price gives a clear sell signal at [s] while the High/Low method whipsaws in and out several times between [s] and [s4].
Typical Price
Typical price uses a single daily price calculated as (High + Low + Close)/3. This offers further smoothing, enabling us to use a smaller, more responsive box size (when compared to the above charts). Although not widely used, the method offers clearer signals, on long-term charts, than the more commonly accepted Closing Price method.
Compare the above chart to the number of signals generated by a Closing Price chart with identical box size.
Setup
To view Point & Figure charts, click View on the
main menu or
![]() on the toolbar.
on the toolbar.
Creating custom P&F charts
- Select the Indicator Panel - Click Indicators on the menu or
 on the toolbar.
 - Select Point and Figure on the Indicator Panel.
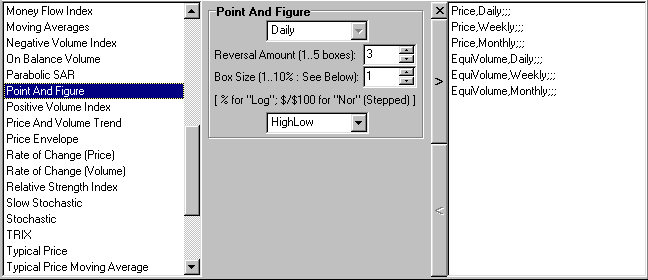
- Adjust the Reversal amount
- Adjust the Box size
on the Indicator Panel
Log scale box sizes are calculated as a % of the price immediately below. Enter "1" and each box will be calculated as 1% of the preceding price.
Normal scale box sizes are stepped as the scale changes. Enter "1" and the box size will be set as $1 for prices over $100. See Point & Figure for more details. - Choose a price option: High/Low, Closing Price or Typical Price
- Save your selection > in the right column
- Close X the Indicator Panel
- Select Logarithmic
 or Normal
 scale on the toolbar
or under View on the
main menu.
scale on the toolbar
or under View on the
main menu.

Author: Colin Twiggs is a former investment banker with almost 40 years of experience in financial markets. He co-founded Incredible Charts and writes the popular Trading Diary and Patient Investor newsletters.
Using a top-down approach, Colin identifies key macro trends in the global economy before evaluating selected opportunities using a combination of fundamental and technical analysis.
Focusing on interest rates and financial market liquidity as primary drivers of the economic cycle, he warned of the 2008/2009 and 2020 bear markets well ahead of actual events.
He founded PVT Capital (AFSL No. 546090) in May 2023, which offers investment strategy and advice to wholesale clients.