How to Read Stock Charts
What is a stock chart?
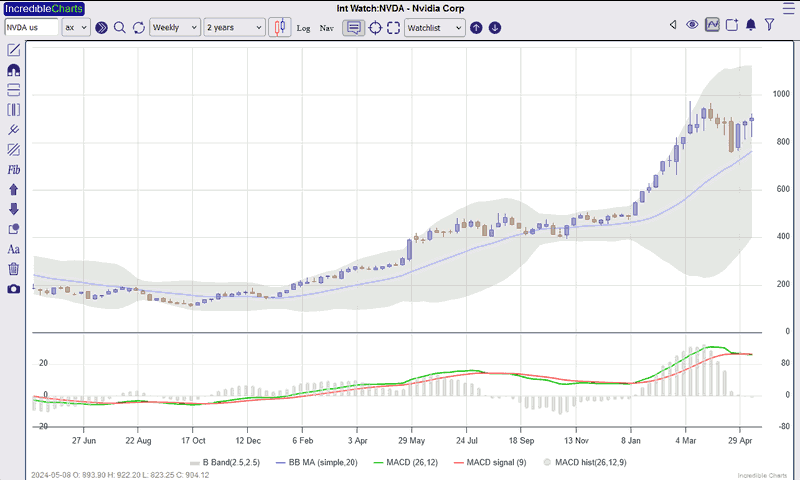
A stock chart displays historical price data of a particular company or index over time. Typically, indicators are used to highlight a particular aspect of price or volume behaviour to provide insight and help with analysis.
What are the four types of stock charts?
Each chart type has a different emphasis.
The four types of stock charts are Bar (OHLC), Candlestick, Line (Close) and Point and Figure.
Bar (OHLC) Charts
Each bar represents price performance for a specific period. These periods may be as long as a month or as short as a minute, daily bars being the most popular.

OHLC stands for the 4 elements displayed on a typical price bar:
- opening price;
- highest price;
- lowest price; and
- closing price.
For more information on this chart type see: Bar Chart.
Candlestick Charts
Each candle represents price performance for a specific period, with greater emphasis on the opening and closing prices.

Similar to bar charts, candles display the open, high, low and close.
For more information on this chart type see: Candle Chart.
Line (Close) Chart
Line charts display the closing prices only on a stock chart.
Point and Figure Charts
Point and Figure charts are used to identify support levels, resistance levels and chart patterns. Point & Figure ignores the time factor and concentrates solely on movements in price: a column of X's or O's may take one day or several weeks to complete.

For more information on this chart type see: Point and Figure Charts.
What can we learn from stock charts?
Here are some of the basic concepts that you will need to know.
Opening and Closing Prices
Opening price is taken from the first trade of the day (or period). The public tend to place orders at the opening of the market, reacting to the previous day's close. Closing price is taken from the last trade of the day (or period). Institutional investors normally watch developments during the day and place orders towards the close. Opening price indicates the emotional direction of the market and the closing price represents (in most cases) a more reasoned and well-researched view.
Open and close are only significant for periods with a definite break before the next opening, as with days or weeks. They should be ignored in analyzing intra-day charts or markets that are open 24 hours a day.
Support and Resistance
A support level is the price at which buyers are expected to enter the market in sufficient numbers to take control from sellers.
A resistance level is the price level at which sellers are expected to enter the market in sufficient numbers to take control from buyers.
For more information on see: Support and Resistance.
Range
The range is the difference between the highest and lowest prices traded during a day (or period).
Control
For every transaction there must be a buyer and a seller - so the actual number of buyers and sellers is always equal. If there are more potential buyers than sellers at the current price, buying pressure will force the price upwards until equilibrium is re-established. The opposite occurs if there are more sellers than buyers - prices will be forced downward. The side that outweighs the other is said to have control.
We can identify control from the position of the closing price in relation to:
- The previous closing price;
- The range; and
- The opening price.
See Bar Charts for more details.
Commitment
If an excess of buyers forces price to rise, some buyers will be deterred by the higher prices and withdraw, and more sellers may be enticed into the market. The rate of withdrawal/entry in response to changing prices is referred to as the commitment (or eagerness) of the party in control.
If buyers are strongly committed they will not deterred by rising prices and will continue to bid the price up, with little profit-taking. Likewise, if sellers are committed they will not be deterred by lower prices and will continue to sell the stock down.
The market provides a number of clues as to the commitment of buyers and sellers:
- the position of closing price relative to the previous close;
- the position of closing price relative to the range;
- expanding or contracting ranges;
- gaps between consecutive ranges; and
- volume traded.
Long and Short Positions
Because of the complexity of trading positions, especially when trading in futures and options, traders avoid the terms buy and sell, and refer to long and short positions.
Long
Going long means buying an asset, a call option or a futures contract with a view to profiting from a rise in the price of the underlying asset.
Short
Going short means selling an asset, buying a put option, selling a call option, or entering a futures contract with a view to profiting from a decline in the price of the underlying asset. Short-selling requires that you borrow stock for delivery, as you have sold an asset you do not own. The intention is to buy later, when the price has fallen, in order to repay the borrowed stock. Short positions are normally only of a few days duration and should only be attempted by experienced traders with the assistance of their broker.
If you are only trading the long side of the market, short signals should be interpreted as a signal to close any long position.
Entry = Open a long or short position.
Exit = Quit a long or short position.
Take profits = Reduce a long or short position.
Time Frames
Markets often trend in more than one direction at the same time: The Dow can be in an upward bull trend (which may endure for several years); while the secondary cycle corrects downwards over several months; and a short-term rally occurs during the current week.
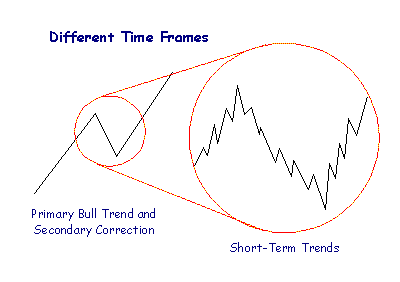
Market cycles may include:
- Long-term (or primary) trends that are measured in years;
- Intermediate (or secondary) trends of 3 weeks up to 6 months;
- Short-term cycles of less than 3 weeks; and
- Intra-day cycles.
What is important to
remember is that long-term trends influence short-term trends.
In an up-trend, rallies tend to be stronger than corrections. In a down-trend,
corrections are mostly stronger than rallies.
Unusual conditions can be created by the interaction of cycles in different time frames. They may offset each other or they may overlap and act in the same direction, resulting in an extreme peak or trough.
Chart Analysis
Avoid becoming hypnotized by movements on daily or intra-day charts. Always analyze charts in at least 2 time frames:
- Determine the strength and direction of longer term trends and
gauge their effect on the cycle being traded.
- Then analyze the cycle being traded.
Estimate the length of cycles by measuring the time taken between consecutive peaks (or troughs).

Author: Colin Twiggs is a former investment banker with over 30 years experience in financial markets. He co-founded Incredible Charts and writes the popular Trading Diary newsletter.
Colin also writes The Patient Investor newsletter which focuses on the global economic outlook and key macro trends.
In addition, he founded PVT Capital (AFSL No. 546090) which offers investment strategy and advice to wholesale clients.