Stochastic Oscillator
The Stochastic Oscillator is used to track market momentum and was developed by Dr. George Lane.
The indicator consists of two lines:
- %K compares the latest closing price to the recent trading range.
- %D is a signal line calculated by smoothing %K.
The number of periods used in the indicator can be varied according to the purpose for which the Stochastic Oscillator is used:
| Purpose: | %K Periods | %D Periods | Overbought level | Oversold level | Comments: |
|---|---|---|---|---|---|
| Combine with trend indicator | 5 to 10 days | 3 days | 80% | 20% | Very sensitive |
| Stand-alone or trade longer cycles | 14 or 21 days | 3 days | 70% | 30% | Only shows important turning points |
Slow Stochastic incorporates further smoothing and is often used to provide a more reliable signal.
Stochastic Oscillator Trading Signals
If the Stochastic Oscillator hovers near 100 it signals accumulation. Stochastic lurking near zero indicates distribution.
The shape of a Stochastic bottom gives some indication of the ensuing rally. A narrow bottom that is not very deep indicates that bears are weak and that the following rally should be strong. A broad, deep bottom signals that bears are strong and that the rally should be weak.
The same applies to Stochastic tops. Narrow tops indicate that the bulls are weak and that the correction is likely to be severe. High, wide tops indicate that bulls are strong and the correction is likely to be weak.
Ranging Markets
Signals are listed in order of their importance:
- Go long on bullish divergence (on %D) where the first trough is below the Oversold level.
- Go long when %K or %D falls below the Oversold level and rises back above it.
- Go long when %K crosses to above %D.
Short signals:
- Go short on bearish divergence (on %D) where the first peak is above the Overbought level.
- Go short when %K or %D rises above the Overbought level then falls back below it.
- Go short when %K crosses to below %D.
Place stop-losses below the most recent minor Low when going long (or above the most recent minor High when going short).
%K and %D lines pointed in the same direction are used to confirm the direction of the short-term trend.
Lane also used Classic Divergences, a type of triple divergence.
Trending Markets
Only take signals in the direction of the trend and never go long when the Stochastic Oscillator is overbought, nor short when oversold.
Use trailing buy- and sell-stops to enter trades and protect yourself with stop-losses.
Long:
If %K or %D falls below the Oversold line, place a trailing buy-stop. When you are stopped in, place a stop loss below the Low of the recent down-trend (the lowest Low since the signal day).
Short:
If Stochastic Oscillator rises above the Overbought line, place a trailing sell-stop. When you are stopped in, place a stop loss above the High of the recent up-trend (the highest High since the signal day).
Exit:
Use a trend indicator to exit.
Stochastic Example
The Slow Stochastic Example illustrates the trading signals. This study focuses on the trailing stop entry technique used in a trending market.
Intel Corporation is shown with a 21 day exponential moving average (MA) and 7 day Stochastic %K and %D. The Moving Average (MA) is used as the trend indicator with closing price as a filter.
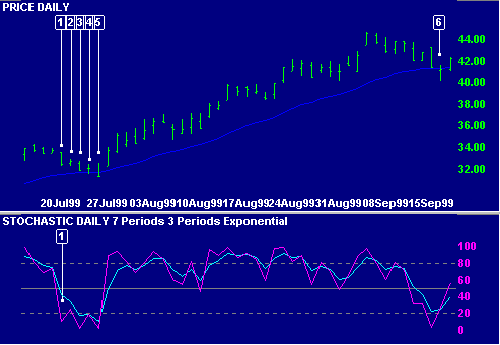
Mouse over chart captions to display trading signals.
- %K falls below 20. Place a trailing buy-stop just above the day's High of $33 1/2.
- Move the buy-stop down to $33, above the High of day 2.
- Move the stop down to above the High of day 3.
- Move the stop down to $32 1/2 - one tick above the High on day 4.
- The day opens with a new Low of $31 3/8 and then rises until we are stopped in at $32 1/2. Place a stop-loss below the Low (i.e.. the lowest Low since day [1]). Thereafter, price falls back to the day's Low, but fails to activate the stop-loss one tick below.
- Exit when price closes below the MA.
Stochastic Oscillator Setup
See Indicator Panel for directions on how to set up an indicator. The default settings are:
- %K - 5 days
- %D - 3 days
- Both are calculated using simple moving averages
- overbought level - 70%
- oversold level - 30%
To alter the default settings - see Edit Indicator Settings.
Stochastic Oscillator Formula
To calculate the Stochastic Oscillator:
- The first step is to decide on the number of periods (%K Periods) to be included in the calculation. The norm is 5 days, but this should be based on the time frame that you are analyzing.
- Then calculate %K, by comparing the latest Closing price to the range
traded over the selected period:
CL = Close [today] - Lowest Low [in %K Periods]
HL =Highest High [in %K Periods] - Lowest Low [in %K Periods]
%K = CL / HL *100 - Calculate %D by smoothing %K. The original formula used a 3 period simple moving average, but this can be varied, based on the time frame that you are analyzing.

Author: Colin Twiggs is a former investment banker with almost 40 years of experience in financial markets. He co-founded Incredible Charts and writes the popular Trading Diary and Patient Investor newsletters.
Using a top-down approach, Colin identifies key macro trends in the global economy before evaluating selected opportunities using a combination of fundamental and technical analysis.
Focusing on interest rates and financial market liquidity as primary drivers of the economic cycle, he warned of the 2008/2009 and 2020 bear markets well ahead of actual events.
He founded PVT Capital (AFSL No. 546090) in May 2023, which offers investment strategy and advice to wholesale clients.