Moving Average High, Low & Open
A new variation on the moving average system is to calculate moving averages on the Highs, Lows or Opens, rather than on the Close.
Time Frames
Daily Highs, Lows or Opens are normally used, but the same concept may work just as well on hourly, weekly or even monthly bars. Opens are used less frequently and the discussion below focuses on Highs & Lows.
Trading Signals
Short-term
In an up-trend:
- Enter when price closes above the moving average (High)
- Exit when price closes below the moving average (Low)
In a down-trend:
- Short when price closes below the moving average (Low)
- Exit when price closes above the moving average (High)
Example
Mouse over chart captions to display trading signals.
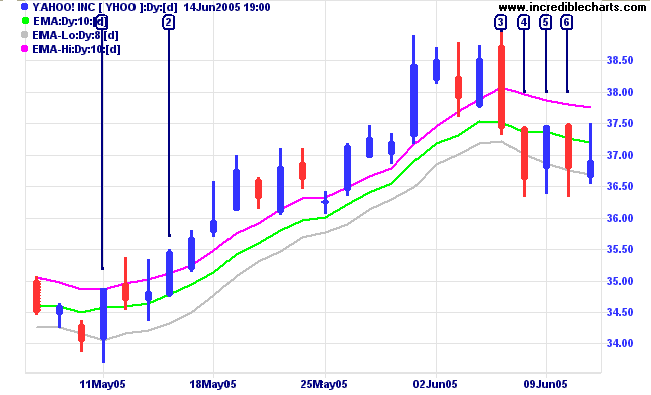
A 13-week moving average of closing prices (not shown) has been used to identify the up-trend on Yahoo (above). The stock is then plotted with a 10-day moving average of daily Highs and an 8-day moving average of daily Lows.
- Enter at [2] when price closes above the moving average (High).
- Exit at [4] when price closes below the moving average (Low).
If we had used a normal 10-day moving average of closing prices, with the same closing price filter:
- Earlier entry at [1] when price closes above the moving average.
- Earlier exit at [3] when price closes below the moving average.
- Then we are whipsawed, with an entry at [5] and exit at [6].
Other filters, besides closing price, may be used to further refine the system.
Evaluation
The system does better than many other moving average systems in eliminating whipsaws, because of the width of the bands; and higher volatility results in wider bands. However, this remains a moving average system with all the attendant weaknesses:
- Late entries at moving average crossovers; and
- Late exits, especially when the trend spikes up/down into a blow-off.
Blow-offs
Mouse over chart captions to display trading signals.
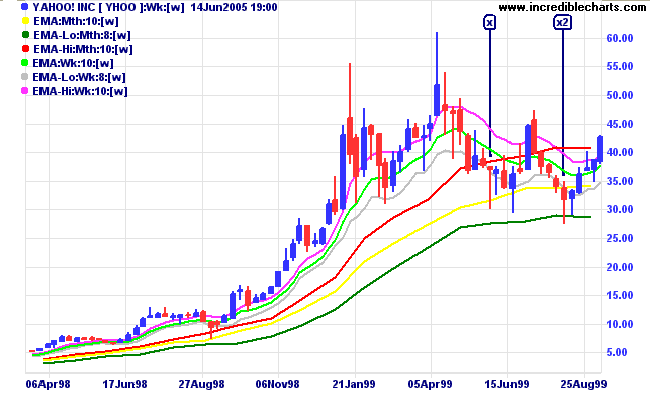
In the above chart Yahoo staged a blow-off, in late 1998/early 1999, when it
accelerated into a steep up-trend. Our long-term
moving averages, so good at keeping us in the trend, now let us down badly,
giving exit signals between $31.50 [x], based on a normal closing price
moving average, and $28.90 [x2], based on the
8-month moving average of monthly lows.
If you are thinking about adding a filter, to avoid being taken out
of the trend at [x2]; forget it. No filter can save you from this:
Long-term MAs cannot be relied upon for exit signals during a blow-off.
Late Entries and Exits
Your aim, when trend-trading, should either be:
- If trading short-term, to enter on corrections and exit when the subsequent primary trend move expires; or
- If long-term, to enter at the start of the trend; ride out the corrections; and exit when the trend expires.
If, when trading short-term, we wait for price to cross the moving average after a correction, in any but the strongest trends, we will lose about half of the entire up-swing. If we use moving average (High) for our buy signals and moving average (Low) for sell signals, the problem is even worse.
Example
System 1
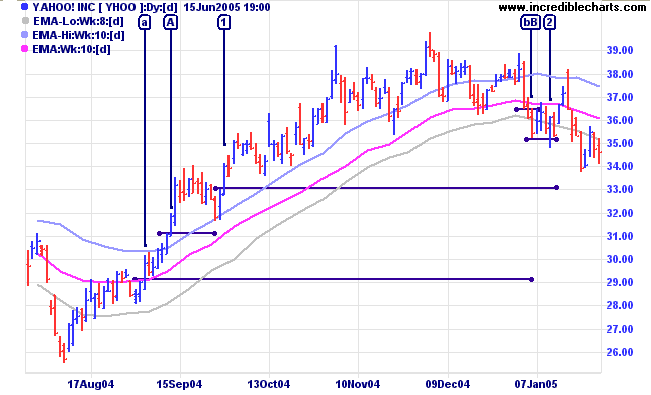
- On the first pull-back (or consolidation pattern) after price breaks above the moving average (High), enter [1] when price closes above the previous high and then takes out the high.
- Exit when price closes below moving average (Low) and then takes out the low at [2].
Compare your profit of $2.20 (before brokerage and slippage) to the swing range of $14.27 (39.79 - 25.52).
Mouse over chart captions to display trading signals.
System 2
- Enter [A] when price closes above moving average (High) and then takes out that day's high.
- Exit [B] when price falls (but not necessarily closes) below the moving average (Low).
Your profit increases to $5.30 before brokerage and slippage.
System 3
If we use the conventional moving average, based on closing price:
- On the first pull-back after price closes above the moving average, if price closes above the previous high, enter [a] when it takes out that day's high.
- Exit [b] when price closes below the moving average and then takes out that low.
Profit increases to $7.42 (36.46 - 29.04). This is a single example and there may be times that system 3 makes a false start or exits too early in the trend, but, from what I have seen, the conventional method at least holds its own against systems based on Highs and Lows.
Setup
Look for Moving Averages (High) and Moving Averages (Low)
in the left column of the Indicator Panel.
Edit Indicator Settings explains
how to alter the default settings.
Moving Average High, Low & Open Formula
Exponential or simple moving averages are calculated using either the High or Low instead of closing price. The Low is often calculated with a shorter moving average than the High: to deliver quicker exit signals. If trading short, reverse the time periods; so that the High is shorter than the Low.

Author: Colin Twiggs is a former investment banker with almost 40 years of experience in financial markets. He co-founded Incredible Charts and writes the popular Trading Diary and Patient Investor newsletters.
Using a top-down approach, Colin identifies key macro trends in the global economy before evaluating selected opportunities using a combination of fundamental and technical analysis.
Focusing on interest rates and financial market liquidity as primary drivers of the economic cycle, he warned of the 2008/2009 and 2020 bear markets well ahead of actual events.
He founded PVT Capital (AFSL No. 546090) in May 2023, which offers investment strategy and advice to wholesale clients.