Detrended Price Oscillator (DPO)
I first discovered the Detrended Price Oscillator in Steven Achelis' Technical Analysis A-Z. Since then it has become a firm favorite. Used to isolate short-term cycles, Detrended Price Oscillator compares closing price to a prior moving average, eliminating cycles longer than the moving average.
The real power of the Detrended Price Oscillator is in identifying turning points in longer cycles:
- When DPO shows a higher trough - expect an upturn in the intermediate cycle;
- When DPO experiences a lower peak - expect a downturn.
Detrended Price Oscillator Trading Signals
First, estimate the maximum length of the cycle that you wish to track. Use half of the cycle length as the MA period. The Detrended Price Oscillator is most effective with indicator periods of 21 days or less.
Ranging Markets
Set overbought and oversold levels based on observation of past price behavior.
- Go long when DPO crosses below and then
back above the oversold level.
- Go short when DPO crosses above and then back below the overbought level.
Use stop-losses at all times.
Trending Markets
Only trade in the direction of the trend.
- Go long when DPO crosses below zero
and then turns back above.
- Go short when DPO crosses above zero and then turns back below.
Only execute trades if the trend is intact (price does not close below the MA). Exit using a trend indicator.
Use stop-losses to protect your position.
Alternative (and more aggressive) rules:
- Go long when DPO forms a higher trough.
- Go short when DPO forms a lower peak.
Trade only in the direction of the trend and always use stop losses.
Example
IBM Corp. with 7 day Detrended Price Oscillator, and 21 day exponential moving average (MA). The Detrended Price Oscillator is used for analyzing the short cycle and the moving average is used to identify and exit trends (with closing price as a filter).
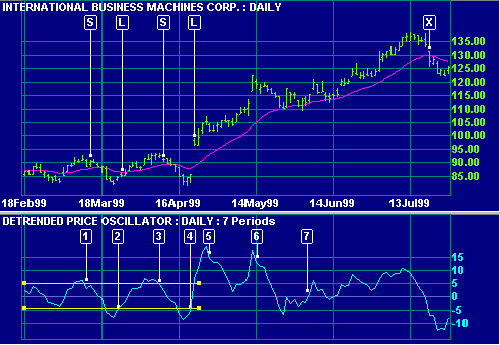
Mouse over chart captions to display trading signals.
- Price is ranging - indicated by the fluctuation around the MA. Go short [S] when Detrended Price Oscillator turns back below the overbought level.
- Go long [L] when the Detrended Price Oscillator turns back above the oversold level.
- Go short [S].
- Go long [L].
- Price breaks out of the trading range - confirmed by the larger Detrended Price Oscillator swing. Switch to trend signals.
- Note how the long trend rises steeply but the Detrended Price Oscillator isolates the short cycle, forming a lower peak. More aggressive traders (see alternative rules) will exit at this point.
- Detrended Price Oscillator crosses back to above the zero line, indicating a useful trend entry point. The up-trend remains intact - there are no closes below the MA. More aggressive traders (alternative rules) would re-enter their position at this point: Detrended Price Oscillator has formed a higher trough.
- Exit when price closes below the MA at [X].
Setup
The default indicator window is set at 20 days. To alter the default settings - Edit Indicator Settings.
See Indicator Panel for directions on how to set up an indicator.
Formula
To calculate the Detrended Price Oscillator:
- Decide on the time frame that you
wish to analyze. Set n as half of that cycle period.
- Calculate a simple
moving average for n periods.
- Calculate (n / 2 + 1)
- Subtract the moving average, from
(n / 2 + 1) days ago, from the closing price:
DPO = Close - Simple moving average [from (n / 2 + 1) days ago]

Author: Colin Twiggs is a former investment banker with almost 40 years of experience in financial markets. He co-founded Incredible Charts and writes the popular Trading Diary and Patient Investor newsletters.
Using a top-down approach, Colin identifies key macro trends in the global economy before evaluating selected opportunities using a combination of fundamental and technical analysis.
Focusing on interest rates and financial market liquidity as primary drivers of the economic cycle, he warned of the 2008/2009 and 2020 bear markets well ahead of actual events.
He founded PVT Capital (AFSL No. 546090) in May 2023, which offers investment strategy and advice to wholesale clients.