Chandelier Exits
Alexander Elder introduced Chuck LeBeau's Chandelier Exits trend-following system in his 2002 book Come Into My Trading Room. The system dangles a multiple of Average True Range from Highs during an up-trend and adds them to Lows during a down-trend. There are several similar systems that use ATR, each with their own strengths and weaknesses:
- Welles Wilder's original Volatility Stops, from his book New Concepts in Technical Trading Systems (1978);
- Average True Range Trailing Stops; and
- Keltner Channels from Chester Keltner in How to Make Money in Commodities (1960).
Dr Elder also developed SafeZone Stops based on Directional Movement rather than Average True Range.
Chandelier Exit Trading Signals
Chandelier Exits are primarily used as a stop loss mechanism to time exits from a trending market.
- Exit long positions when price crosses below the Chandelier line
- Exit short positions when price crosses above the Chandelier line
Chandeliers cannot be used for entries like some other volatility systems as they would be prone to whipsaw in and out of a trade.
Example
The RJ CRB Commodities Index late 2008 down-trend is displayed with Chandelier Exit (short, 22 days and 3 x ATR) and 63-day exponential moving average used as a trend filter. Entries are taken when price makes a new 5-day low while below the moving average (or 5-day high when above the MA).
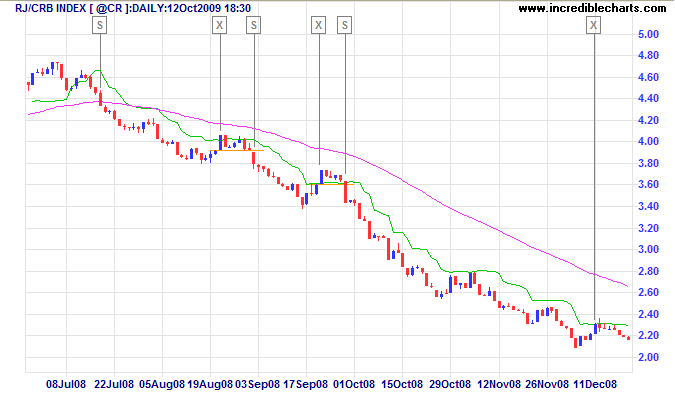
Mouse over chart captions to display trading signals.
- Go short [S] when price is below the Chandelier Exit and closes below the 63-day exponential moving average
- Exit [X] when price crosses above the Chandelier Exit
- Go short [S] when price makes a new 5-day low while below the 63-day exponential moving average
- Exit [X] when price crosses above the Chandelier Exit
- Go short [S] when price makes a new 5-day low while below the 63-day exponential moving average
- Exit [X] when price crosses above the Chandelier Exit
Setup
The default settings for Chandelier exits are a 22-day period and a multiple of 3.0 times Average True Range.
See Indicator Panel for directions on how to set up an indicator — and Edit Indicator Settings to change the settings.
Chandelier Exit Formula
Chandelier Exits subtract a multiple of Average True Range ("ATR") from the highest high for the selected period. Using the default settings as an example:
Highest High in last 22 days - 3 * ATR for 22 days
In a down-trend the formula is reversed:
Lowest Low in last 22 days + 3 * ATR for 22 days
- The time period must be long enough to capture the highest point of the recent up-trend: too short and the stops move downward; too long and the high may be taken from a previous down-trend.
- It is not essential to use the same period for up and down trends; down-trends are notoriously faster than up-trends and may benefit from a shorter time period.
- The multiple of 3 may be varied, but most traders settle between 2.5 and 3.5.
Chandelier Evaluation
I am uneasy with stops moving lower during an up-trend. This may occur with Chandelier Exits when:
- Average True Range increases, or
- No new high is made during the selected time frame (22-days in the earlier example).
Welles Wilder's Volatility Stops formula eliminates the second issue, but uses Closing Price rather than Highs and Lows. Average True Range Trailing Stops, on the other hand, offer both High/Low and Closing Price options and use a ratchet mechanism to prevent stops from falling during an up-trend or rising during a down-trend.

Author: Colin Twiggs is a former investment banker with almost 40 years of experience in financial markets. He co-founded Incredible Charts and writes the popular Trading Diary and Patient Investor newsletters.
Using a top-down approach, Colin identifies key macro trends in the global economy before evaluating selected opportunities using a combination of fundamental and technical analysis.
Focusing on interest rates and financial market liquidity as primary drivers of the economic cycle, he warned of the 2008/2009 and 2020 bear markets well ahead of actual events.
He founded PVT Capital (AFSL No. 546090) in May 2023, which offers investment strategy and advice to wholesale clients.