Bull & Bear Traps In Primary Trends
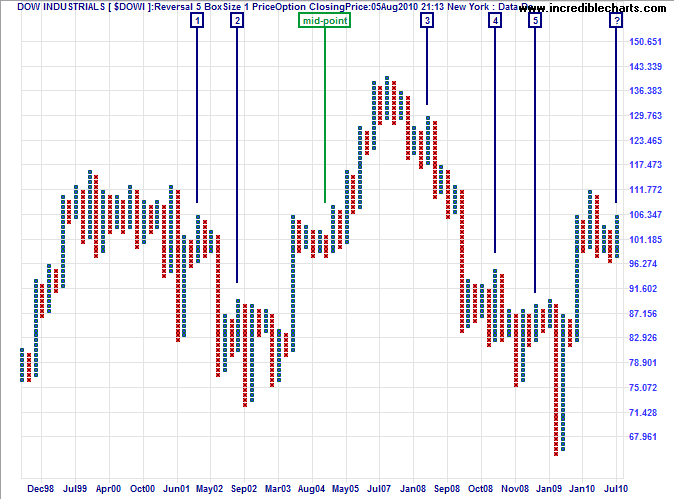
I have been warning readers that upward breakouts in a primary down-trend are notoriously unreliable and feel I should back this up with some charts. The question facing us is whether the 2010 consolidation signals the start of a new bear market, or is merely a mid-point consolidation similar to the Dow in 2004.
Point and figure charts help to eliminate market "noise" and allow us to focus on major trend moves. Analyzing bull and bear marketsfor the last two decades, we compare the number of bull traps observed to the number of bear traps when the market is bullish. Indexes covered are:
- US: DJIA, S&P 500, and NASDAQ 100
- UK: FTSE 100
- Germany: DAX
- France: CAC-40
- Japan: Nikkei 225
- China: Shanghai Composite
We also measure the extent of each breakout before it retreats into a bull or bear trap: the number of point and figure boxes advanced above the previous resistance level (for a bull trap) or below the previous support level (in a bear trap). The results are used to calculate a level of confidence for breakout signals on the point and figure chart. The level of confidence, of course, assumes that future bull or bear markets behave in a similar fashion to the last two cycles.
Point & Figure Settings
It is important to select point and figure settings that eliminate most market noise, but respond fairly quickly to real trend changes:
- P&F type: Closing Price
- Scale: Logarithmic
- Box size: 1
- Reversal amount: 5
Summary Of Results
The 8 indexes measured recorded a total of 53 bull traps in the last two bear markets (an average of 3.31 per bear market). When we compare that to the 25 bear traps observed in the last two bull markets (an average of 1.56 per bull market), we find that bull traps out-number bear traps by a ratio of more than 2 to 1. An interesting result, considering that bull markets endure far longer than bear markets.
Here are the scatter plots, with boxes on the y-axis:
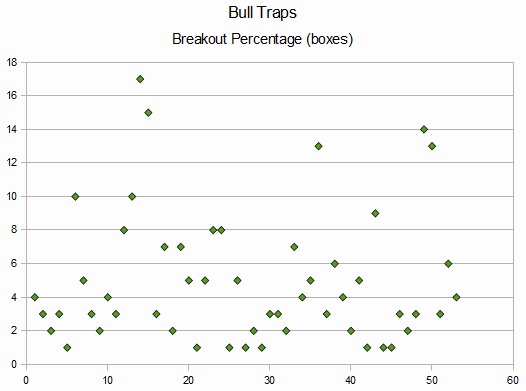
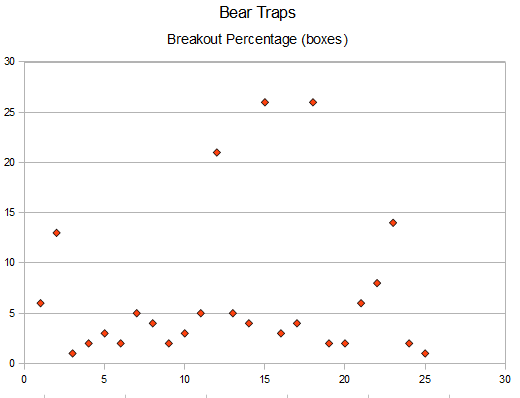
Details of each market are recorded below, or you can skip to the Conclusion.
US Markets
The Dow Jones Industrial Average recorded 5 bull traps in the last two bear markets, compared to 3 bear traps in the last two bull markets — the last at the mid-point consolidation in 2004.
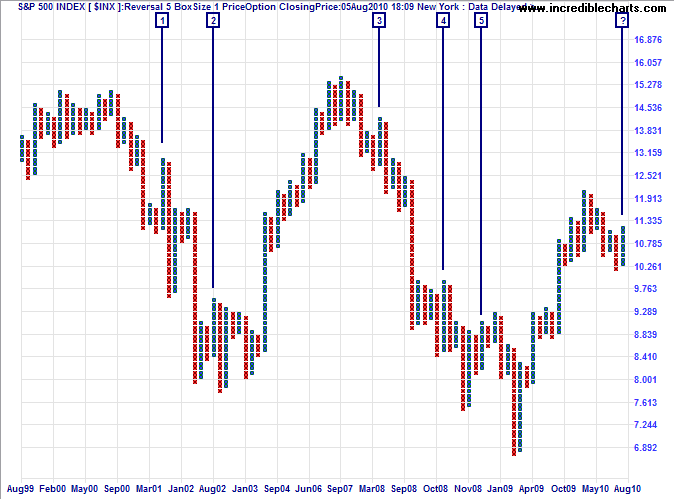
The S&P 500 recorded 5 bull traps in the last two bear markets, compared to 3 bear traps in the 1991 – 2000 bull market and none in 2003 – 2007.
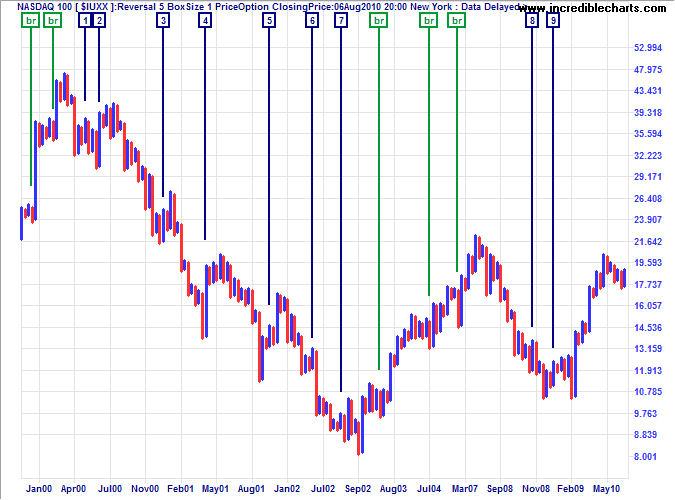
The NASDAQ 100 shows 12 bull traps, compared to 9 bear traps [br] in the last two bull markets.
Europe
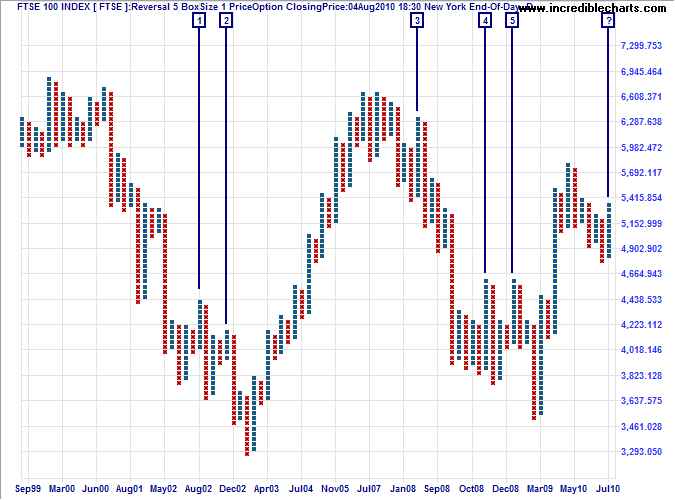
The FTSE 100 scores 5 bull traps, compared to 2 bear traps in the 1991 – 2000 bull market and none in 2003 – 2007.
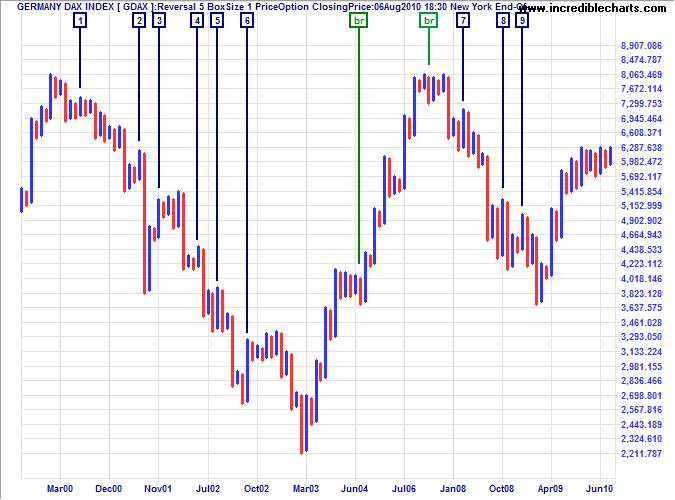
The DAX records 9 bull traps against 8 bear traps [br].
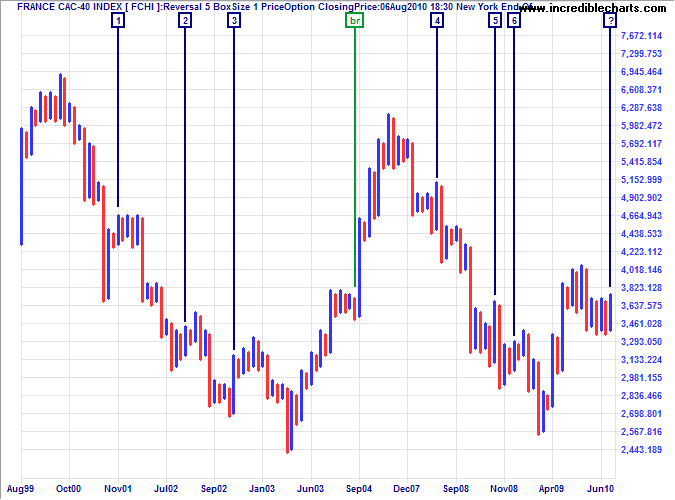
The French CAC-40 Index ranks 6 to 3 [br].
Asia
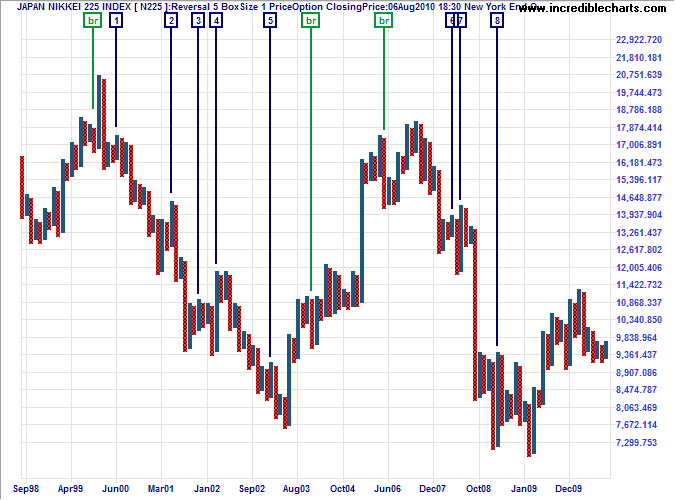
The Nikkei 225 reflects 8 bull traps versus 3 bear traps [br].
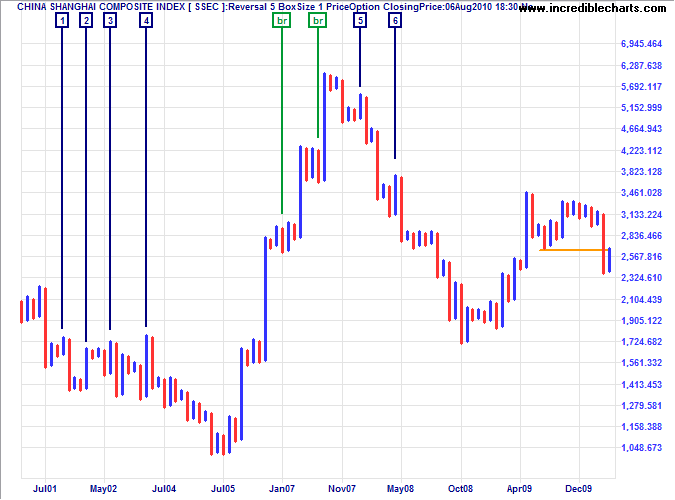
The Shanghai Composite is closer at 6 to 3.
Results
Download the detailed statistics at Bull & Bear Trap Statistics (PDF).
Conclusion
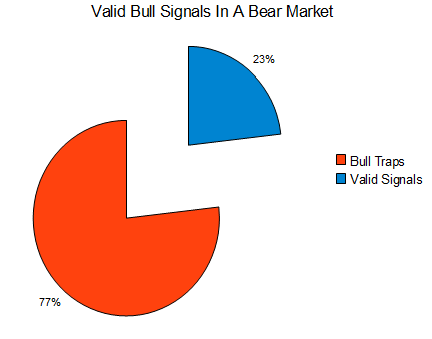
Anyone trading point and figure breakouts in the last two cycles would have encountered a large number of false breakouts. There were 53 bull traps in the last two bear markets compared to 16 valid signals. That does not necessarily mean that trading breakouts is unprofitable. Just that the bar is set pretty high: each correct trade must make 3.3 times the average loss incurred during a bull trap — just to break even.
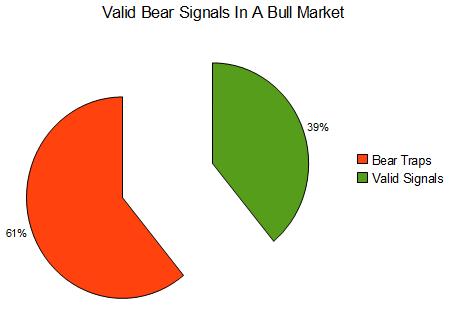
The number of bear traps in the last two bull markets was 25, compared to 16 valid signals. The bar is lower: each correct trade must make 1.6 times the average loss incurred during a bear trap.
Improving Confidence Levels
Adding a filter would improve results. Filtering for breakouts of more than 3 boxes would eliminate roughly half of all bull traps, and improve the confidence level from 23% to 37%. Similarly, a box size greater than 3 would eliminate almost half all bear traps, offering a higher confidence level of 53% — because there are fewer false signals.
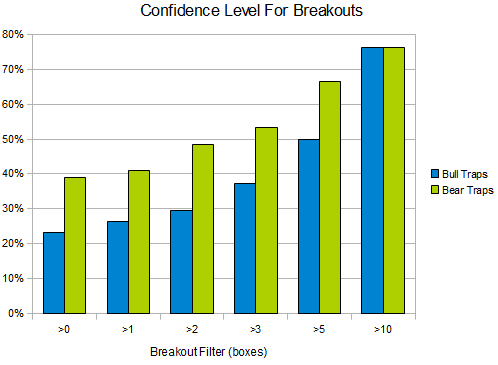
The above chart demonstrates that, to achieve a 50% confidence level, you would need to apply a filter of 5 boxes (i.e. 5.0%) to bull signals — but only 3 boxes (3.0%) for bear signals. For a 75% confidence level, you need a filter of 10 boxes for both bull and bear signals.
Bear in mind that valid signals delivered gains from 30% (Dow/FTSE 200) to 500% (Nasdaq/Shanghai) in the past two decades. The optimal filter could be as low as 2 or 3 boxes, provided you are able to restrict your losses when the bull or bear trap springs shut.
My next update will discuss optimal filter sizes and how to trade bull traps in a bear market.

Author: Colin Twiggs is a former investment banker with almost 40 years of experience in financial markets. He co-founded Incredible Charts and writes the popular Trading Diary and Patient Investor newsletters.
Using a top-down approach, Colin identifies key macro trends in the global economy before evaluating selected opportunities using a combination of fundamental and technical analysis.
Focusing on interest rates and financial market liquidity as primary drivers of the economic cycle, he warned of the 2008/2009 and 2020 bear markets well ahead of actual events.
He founded PVT Capital (AFSL No. 546090) in May 2023, which offers investment strategy and advice to wholesale clients.
