Trading Diary
February 26, 2005
These extracts from my daily trading diary are for educational
purposes and should not be interpreted as investment advice. Full
terms and conditions can be found at Terms
of Use.
USA
The Dow Industrial Average has had a turbulent week. Stocks fell sharply on Tuesday, with a large red candle and strong volume. Support then held at 10600, with a 3-day rally testing resistance at 10850 to 10860. Lighter volume on the rally indicates that resistance may hold and we could see further consolidation between 10860 and 10600.
The Dow Industrial Average has had a turbulent week. Stocks fell sharply on Tuesday, with a large red candle and strong volume. Support then held at 10600, with a 3-day rally testing resistance at 10850 to 10860. Lighter volume on the rally indicates that resistance may hold and we could see further consolidation between 10860 and 10600.
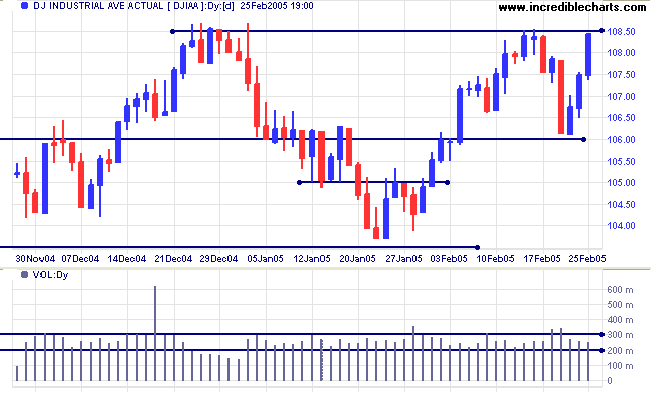
A rise above 10860 would signal that further gains (and a test of
resistance at 11400) can be expected.
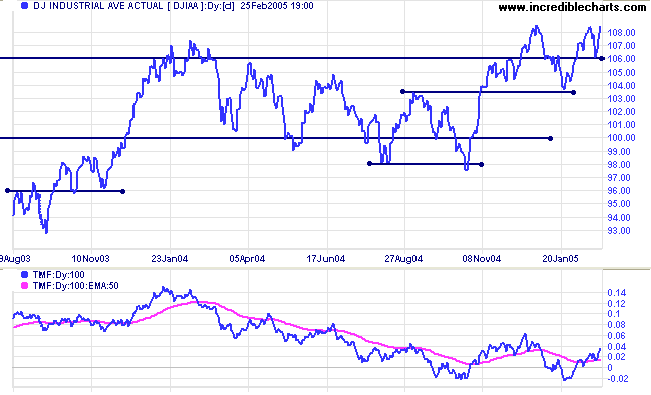
Twiggs Money Flow has strengthened: the last pull-back respected the signal line and the indicator appears about to complete a broad double bottom.
Twiggs Money Flow has strengthened: the last pull-back respected the signal line and the indicator appears about to complete a broad double bottom.
The Nasdaq Composite is headed for a third test of
resistance at 2100, after failed attempts at [b] and [c]. With
successive lower lows at [c] and [e], and fairly light volume on
Friday, we may see further consolidation between 2000 and 2100.
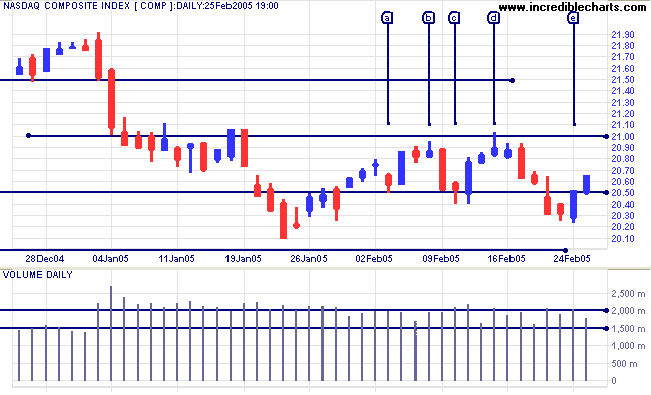
A fall below 2000 would signal a re-test of support at 1750,
while a rise above 2150 would signal an upward breakout.
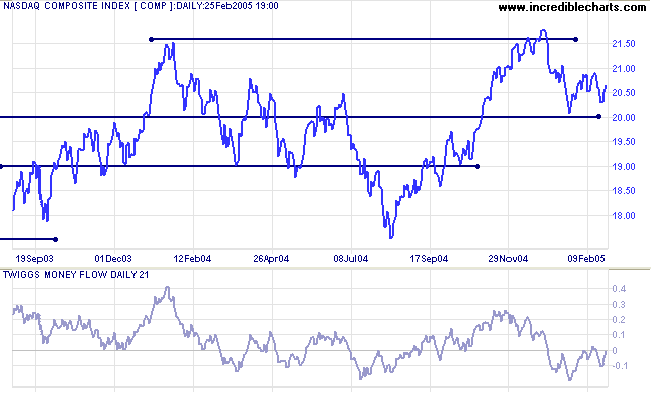
Twiggs Money Flow (21-day) is weaker than the Dow or S&P 500, lingering below the zero line.
Twiggs Money Flow (21-day) is weaker than the Dow or S&P 500, lingering below the zero line.
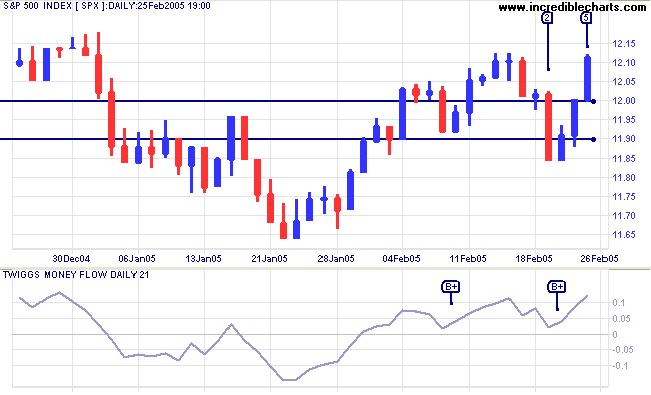
The S&P 500 fell through support with a strong red
candle on Tuesday [2]. The index then recovered, with a 3-day
rally returning the index back above 1200.
A pull-back that respects support at 1200 would be a bull signal, while another fall below 1200 would signal weakness.
Twiggs Money Flow has completed a second bullish trough above the zero line, favoring an upside breakout.
A pull-back that respects support at 1200 would be a bull signal, while another fall below 1200 would signal weakness.
Twiggs Money Flow has completed a second bullish trough above the zero line, favoring an upside breakout.
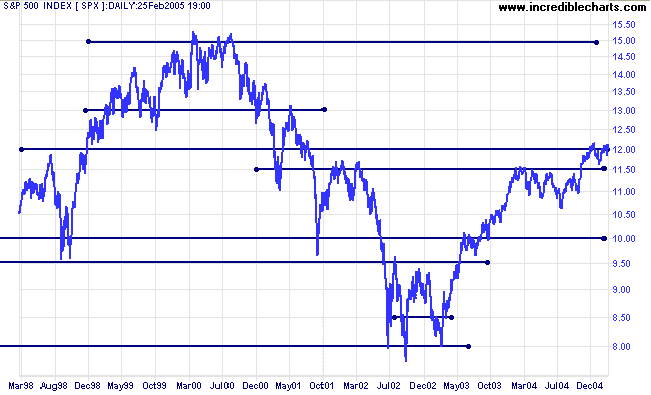
On the longer-term chart we can see the significance of support
at 1150/1160. The market has a positive outlook as long as the
index stays north of this line.
|
|
Treasury yields
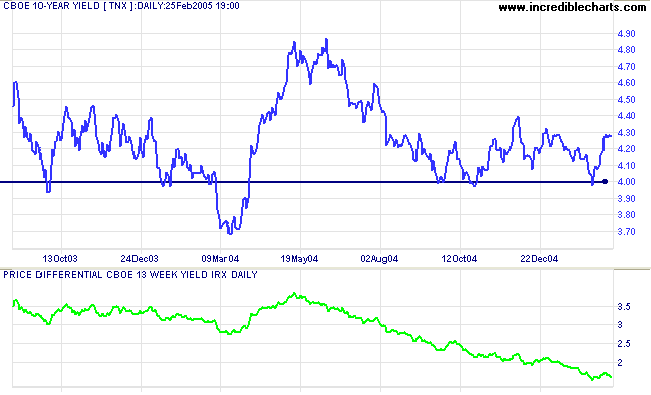
Last week's jump in the core PPI gave long-term yields a boost, with the yield on 10-year treasury notes back above 4.25%.
The yield differential (10-year T-notes minus 13-week T-bills) continues to weaken: back at 1.6% this week.
Below 1.0% would be a (long-term) bear signal for equity markets.
Last week's jump in the core PPI gave long-term yields a boost, with the yield on 10-year treasury notes back above 4.25%.
The yield differential (10-year T-notes minus 13-week T-bills) continues to weaken: back at 1.6% this week.
Below 1.0% would be a (long-term) bear signal for equity markets.
Gold
New York: Spot gold has broken above resistance at $430 (upper border of the recent consolidation) with Friday closing at $434.70.
If this holds, we are likely to see a test of resistance at $450. Look for a pull-back that respects the new support level at $430.
New York: Spot gold has broken above resistance at $430 (upper border of the recent consolidation) with Friday closing at $434.70.
If this holds, we are likely to see a test of resistance at $450. Look for a pull-back that respects the new support level at $430.
|
ASX Australia
After a brief consolidation the All Ordinaries fell sharply on strong volume at [3]. The attempted rally [4] at the first line of support quickly faded, ending in further losses; but buyers were able to gain control on Friday [5], with a tall blue candle on strong volume.
Expect a test of the initial resistance level at 4130. If this holds, there is likely to be another strong down-swing.
A fall below the low of [5] would signal that a test of support at 4030 is imminent.
A rise above 4160 would signal that the intermediate trend has reversed upwards.
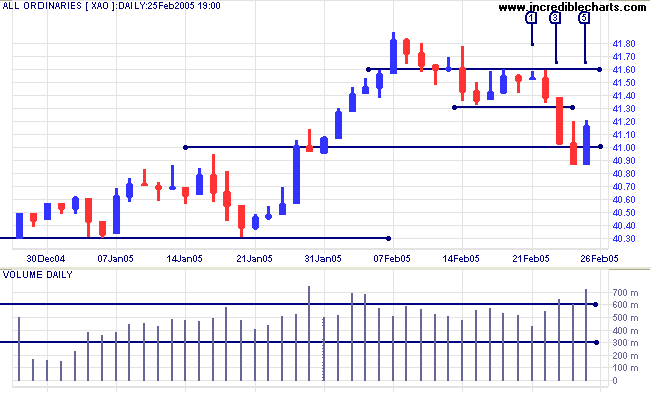
Twiggs Money Flow displays a strong bear signal, with a peak
below the signal line, followed by a fall below preceding lows. A
recovery that fails to break above the resistance line would add
further confirmation.
Weekly reminder:
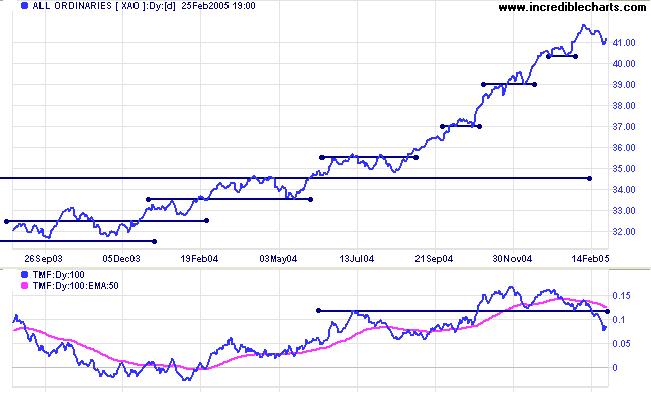
Bear in mind that at some point there is likely to be a correction back to 3450. This is based on observation of the All Ords over the past 25 years, where the index has regularly tested support at previous long-term highs during an up-trend.
Bear in mind that at some point there is likely to be a correction back to 3450. This is based on observation of the All Ords over the past 25 years, where the index has regularly tested support at previous long-term highs during an up-trend.
For further assistance, read About
the Trading Diary.
Colin Twiggs
A disciplined mind is a free mind.
Gain control over your thoughts and you maintain control over your life.
Retrain your mind and you regain your freedom.
~ Andrew Pacholyk: Peaceful Mind
Gain control over your thoughts and you maintain control over your life.
Retrain your mind and you regain your freedom.
~ Andrew Pacholyk: Peaceful Mind
Back Issues
Access the Trading Diary Archives.