Trading Diary
January 8, 2005
These extracts from my daily trading diary are for educational
purposes and should not be interpreted as investment advice. Full
terms and conditions can be found at Terms
of Use.
USA
The Dow Industrial Average has so far consolidated above support at 10600.
A successful test of support would be a strong bull signal, signaling a likely rally targeting resistance at 11400. Modest volumes are an encouraging sign while the index holds above the support level, signaling the absence of selling pressure. A rise above Thursday's high of 10670, accompanied by stronger volumes, would add further confirmation
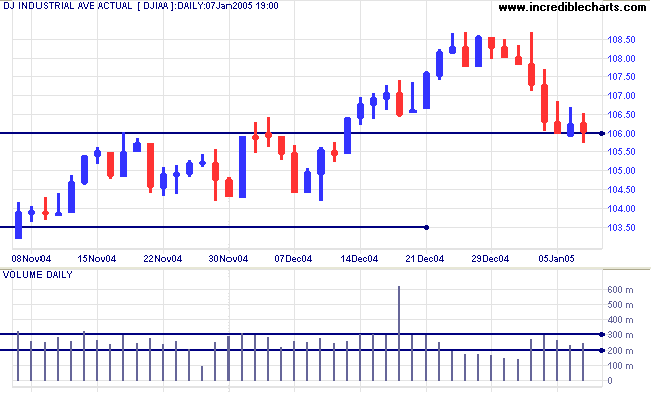
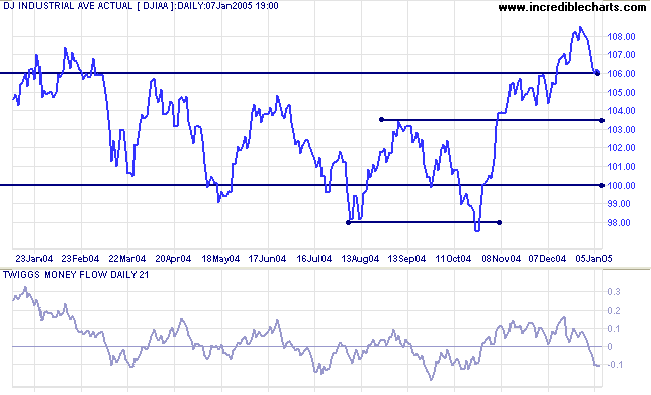
A word of caution. The 21-day
Twiggs Money Flow has fallen below zero, signaling
distribution, and we should not anticipate the bull signal: there
could well be a break below 10600. If initial support at 10350
(from the previous peak) does not hold, that would signal a test
of support at 10000.
A fall below 10000 would be a (long-term) bear signal.
A fall below 10000 would be a (long-term) bear signal.
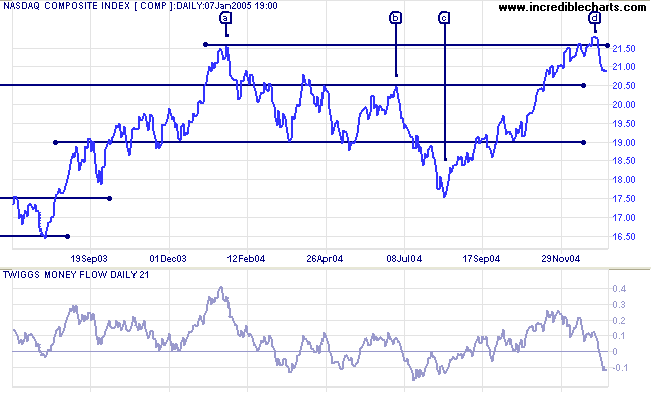
The Nasdaq Composite index has retreated sharply after a
marginal (false) break [d] above the previous high of [a].
Initial support is at 2050 [b] with primary support at 1750
[c].
Twiggs Money Flow (21-day) has fallen sharply below zero, signaling distribution.
Twiggs Money Flow (21-day) has fallen sharply below zero, signaling distribution.
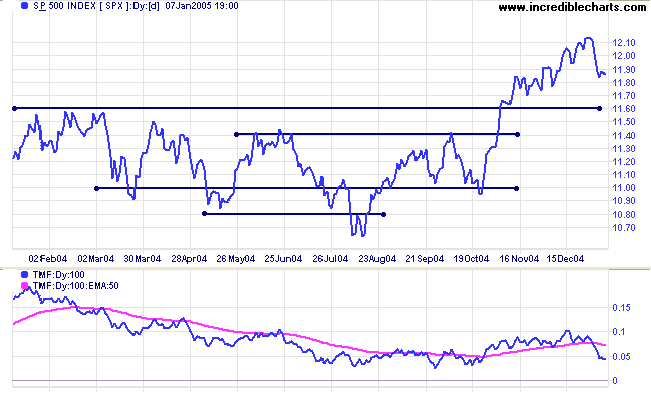
The S&P 500 has formed a rising broadening wedge
pattern over the last two months. This is a bearish reversal
pattern and we may see a test of support at 1160. A close below
the lows of the last week would complete the pattern.
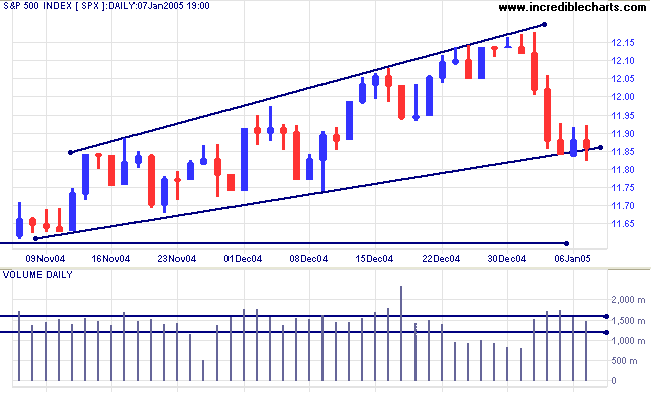
Twiggs Money Flow signals distribution with a sharp fall
below the signal line.
The primary trend direction is still upwards but we may be headed for a period of correction/consolidation. The first level of support is at 1160, with major support at 1100.
The primary trend direction is still upwards but we may be headed for a period of correction/consolidation. The first level of support is at 1160, with major support at 1100.
|
|
Treasury yields
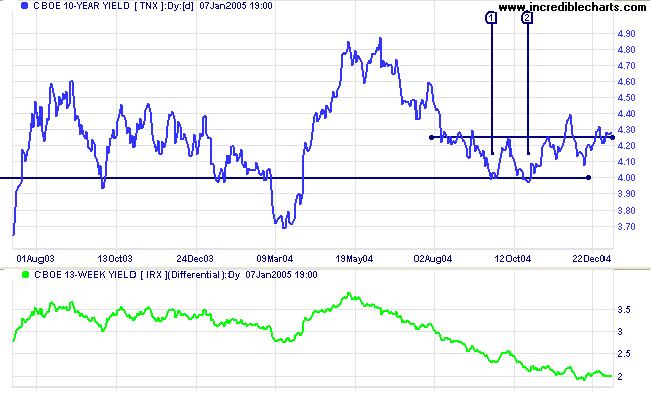
The yield on 10-year treasury notes has edged above resistance at 4.25%. Soft long-term yields indicate that the bond market is holding its own, with no major outflows to equities markets.
The yield differential (10-year T-notes minus 13-week T-bills) is holding at 2.0%. A fall below 1.0% would be a long-term bear signal.
Gold
New York: Spot gold has broken through the first level of support at $430 and is currently trading at $418.40. Apart from the psychological barrier of $400, major support is at the 1-year low of $375.
New York: Spot gold has broken through the first level of support at $430 and is currently trading at $418.40. Apart from the psychological barrier of $400, major support is at the 1-year low of $375.
|
ASX Australia
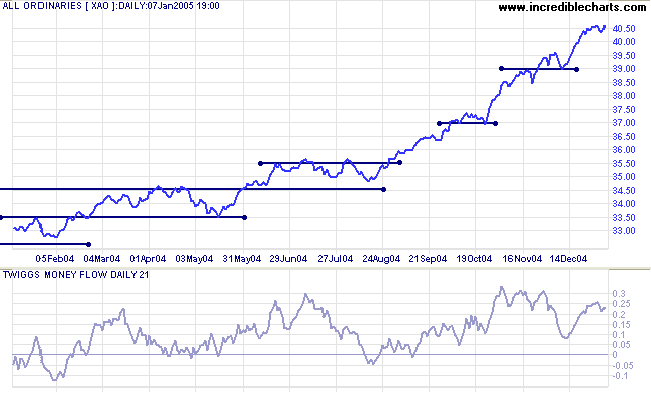
Despite bearish rumblings from US markets, the All Ordinaries retraced the last two days downswing with a tall blue candle on average volume. The short pull-back at [C] on modest volume and the lack of serious resistance at the 4000 level (the index consolidated for a single day at [B] on lower volume) both indicate that the ASX is in a bull market. And those of you who follow Bill McLaren will recognize the space between the latest low [C] and the previous high [A]: signaling a fast up-trend.
Despite bearish rumblings from US markets, the All Ordinaries retraced the last two days downswing with a tall blue candle on average volume. The short pull-back at [C] on modest volume and the lack of serious resistance at the 4000 level (the index consolidated for a single day at [B] on lower volume) both indicate that the ASX is in a bull market. And those of you who follow Bill McLaren will recognize the space between the latest low [C] and the previous high [A]: signaling a fast up-trend.
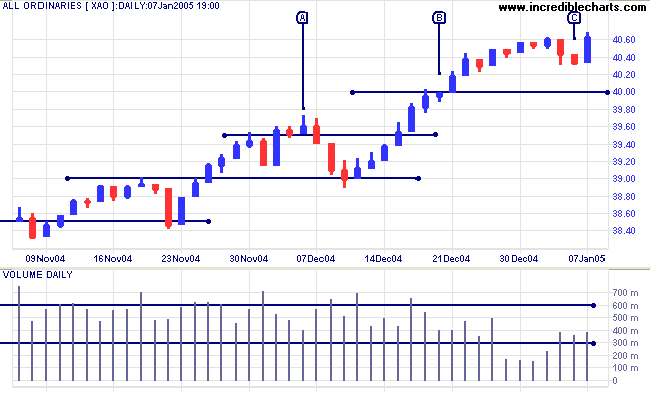
Further confirmation is provided by the 21-day
Twiggs Money Flow which has not crossed below the zero line
since last August.
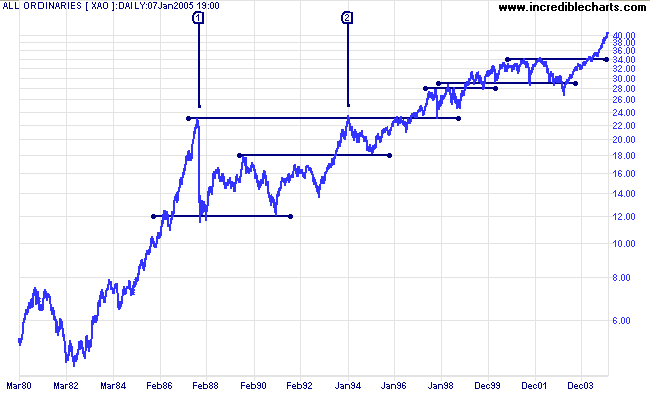
Unless the market is weighed down by a strong correction in the
US, it could run a lot further. Bear in mind that the more
extended the rally becomes, the more severe the eventual
correction is likely to be. While not in the same league as the
1987 spike at [1] below, the index is in a fast up-trend similar
to [2] and a correction, when it does come, is likely to test
support at the 2002 high of 3450 (xjo: 3500).
For further assistance, read About
the Trading Diary.
We wish you peace, health and prosperity in the year ahead.
Regards,
We wish you peace, health and prosperity in the year ahead.
Regards,
Colin Twiggs
Nine-tenths of wisdom consists of being wise in
time.
~ Teddy Roosevelt
~ Teddy Roosevelt
Back Issues
Access the Trading Diary Archives.