New Subscription Page
|
The new subscription page is at Subscribe. The Premium Charting service and the Daily Trading Diary are now available separately at $180 AUD each, or $270 for the combined service (as previously offered). Members who wish to amend their subscription to one of the new options should contact members support, with their ShopperID or Activation Key. |
Trading Diary
February 13, 2004
These extracts from my daily trading diary are
for educational purposes and should not be interpreted as
investment advice. Full terms and conditions can be found at
Terms
of Use .
USA
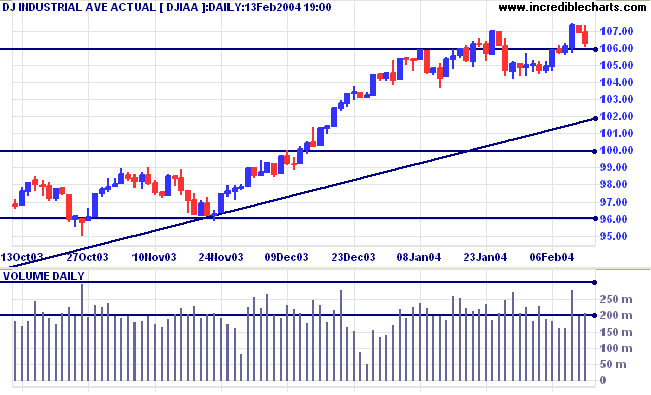
The Dow Industrial Average closed at 10627 after testing support
at 10600.
A fall below the recent low of 10417 would signal a re-test of support at 10000.
The primary trend is up. Resistance is at 11300 to 11350. A fall below support at 9600 would indicate the start of a down-trend.
A fall below the recent low of 10417 would signal a re-test of support at 10000.
The primary trend is up. Resistance is at 11300 to 11350. A fall below support at 9600 would indicate the start of a down-trend.
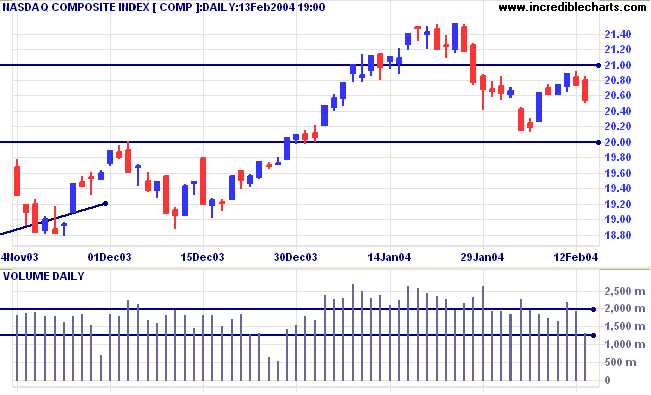
The Nasdaq Composite closed down 20 points at 2053. The strong
downward bar and light volume signal a lack of buying
support.
The intermediate trend is down. Support is at 2000.
The primary trend is up. A fall below support at 1640 would signal reversal.
The intermediate trend is down. Support is at 2000.
The primary trend is up. A fall below support at 1640 would signal reversal.
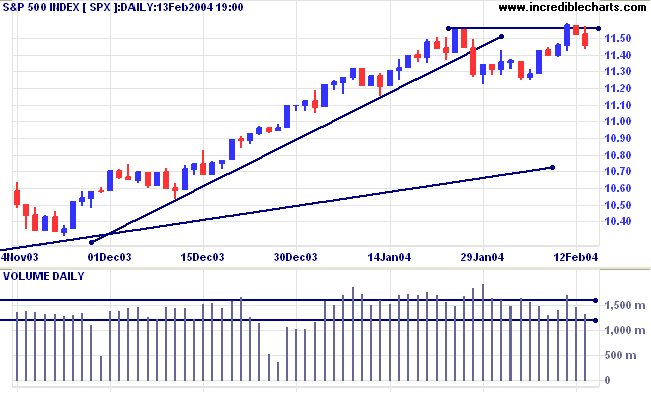
The S&P 500 has retreated to 1145 after a false break above
the previous high. Expect a re-test of support at the previous
low of 1122.
The intermediate trend is uncertain.
The primary trend is up. Expect strong support at 1000. A fall below 960 would signal reversal.
Intermediate: Bullish above 1155. Long-term: Bullish above 1000.
The intermediate trend is uncertain.
The primary trend is up. Expect strong support at 1000. A fall below 960 would signal reversal.
Intermediate: Bullish above 1155. Long-term: Bullish above 1000.
The Chartcraft NYSE Bullish % Indicator rallied
to 85.47%.
More than 80% of NYSE stocks are in an up-trend, the highest level in 10 years.
More than 80% of NYSE stocks are in an up-trend, the highest level in 10 years.
Fed gives positive outlook
Chairman Alan Greenspan says that the economy has turned the corner but the central bank will be patient in deciding when to raise interest rates. (more)
Chairman Alan Greenspan says that the economy has turned the corner but the central bank will be patient in deciding when to raise interest rates. (more)
Treasury yields
The yield on 10-year treasury notes is consolidating around 4.05% over the last 2 days.
The intermediate trend is down.
The primary trend is up. A close below the September low of 3.93% would signal reversal.
The yield on 10-year treasury notes is consolidating around 4.05% over the last 2 days.
The intermediate trend is down.
The primary trend is up. A close below the September low of 3.93% would signal reversal.
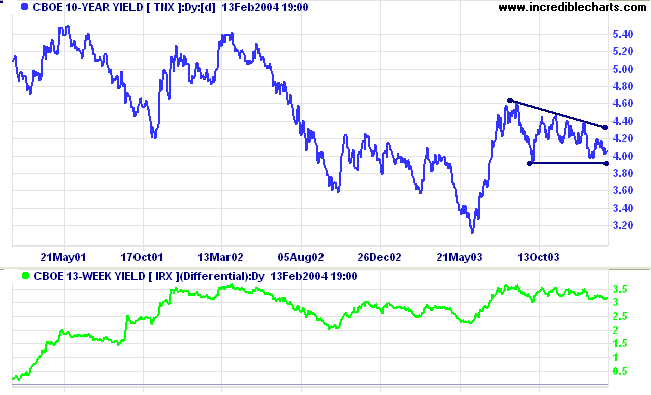
The
yield differential (10-year T-notes compared to 13-week
T-bills) is a healthy 3.1%.
See Interest Rates for a discussion of the yield differential.
See Interest Rates for a discussion of the yield differential.
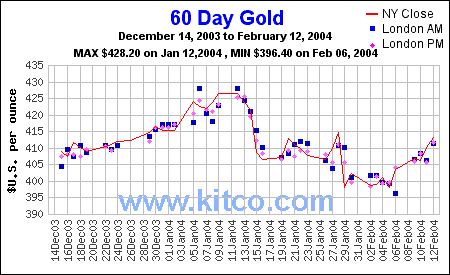
Gold
New York: Spot gold ended the week slightly lower at $409.90.
The intermediate trend is uncertain. Support is at 400.
The primary trend is up. A fall below $370 would signal reversal.
New York: Spot gold ended the week slightly lower at $409.90.
The intermediate trend is uncertain. Support is at 400.
The primary trend is up. A fall below $370 would signal reversal.
Subscribe to Incredible Charts Premium
Charting service with:
|
for only $18 (AUD) per month
ASX Australia
The All Ordinaries closed at 3347, after testing resistance at
3350. Expect short-term consolidation and, possibly, retracement,
before another test of resistance.
Short-term: Bullish above 3350. Bearish below 3266.
Short-term: Bullish above 3350. Bearish below 3266.
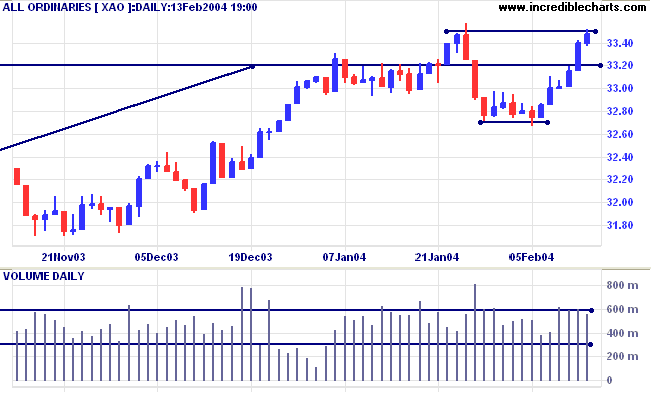
Twiggs Money Flow (100) has rallied back above its 3-month
support level.
The primary trend is up. A fall below 3160 (the October 1 low) would signal reversal.
Intermediate term: Bullish above 3350. Bearish below 3160.
Long-term: Bearish below 3160.
The primary trend is up. A fall below 3160 (the October 1 low) would signal reversal.
Intermediate term: Bullish above 3350. Bearish below 3160.
Long-term: Bearish below 3160.
Sector Analysis
The 11 sectors (10 + Property) are in various market stages. Relative Strength (xjo) measures the performance of each sector relative to the overall index.
The 11 sectors (10 + Property) are in various market stages. Relative Strength (xjo) measures the performance of each sector relative to the overall index.
- Energy [XEJ] - stage 2 (RS is rising)
- Materials [XMJ] - stage 2 (RS is level)
- Industrials [XNJ] - stage 2 (RS is rising)
- Consumer Discretionary [XDJ] - stage 3 (RS is level)
- Consumer Staples [XSJ] - stage 3 (RS is falling)
- Health Care [XHJ] - stage 1 (RS is level)
- Property Trusts [XPJ] - stage 3 (RS is level).
- Financial excl. Property [XXJ] - stage 3* (RS is rising)
- Information Technology [XIJ] - stage 3 (RS is falling)
- Telecom Services [XTJ] - stage 3 (RS is falling)
- Utilities [XUJ] - stage 2 (RS is level)
*Financials-X-Property [XXJ] has made a stronger breakout
from the lengthy consolidation pattern. It may be prudent to wait
for a pull-back to confirm the change to a stage 2 up-trend (if
it respects the new support level).
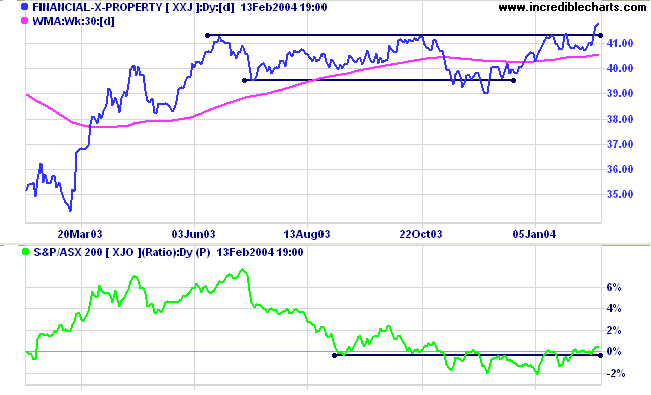
Sectors: Relative Strength
A stock screen of the ASX 200 using % Price Move (1 month: +5%) increased to 36 stocks, from 21 last week.
The highest reading was 131 on April 11, 2003 and the lowest was 8 on March 14, 2003.
Prominent sectors:
(the figure in brackets shows the number of
stocks from an industry that were returned in the screen).A stock screen of the ASX 200 using % Price Move (1 month: +5%) increased to 36 stocks, from 21 last week.
The highest reading was 131 on April 11, 2003 and the lowest was 8 on March 14, 2003.
Prominent sectors:
- Diversified Metals & Mining (4)
- Construction Materials (3)
About
the Trading Diary has been expanded to offer further
assistance to readers, including directions on how to search the
archives.
Colin Twiggs
Perfection is achieved, not when there is nothing more to
add,
but when there is nothing left to take away.
~ Antoine de Saint-Exupery.
but when there is nothing left to take away.
~ Antoine de Saint-Exupery.
|
Subscribe as a Premium Member and receive both:
|
for only $27 (AUD) per
month
Back Issues
You can now view back issues at the Daily Trading Diary Archives.
You can now view back issues at the Daily Trading Diary Archives.
Back Issues
Access the Trading Diary Archives.