Membership subscriptions
We want to thank existing members for their support and offer a reduced subscription to all
who subscribe by 15 February 2003.
The reduced subscription is $180 for the year (or $18 per month). Normal subscription will be $270 (or $27 per month).
There will be a free trial period for all members to evaluate the new services.
Please give us your feedback and suggestions
at the Chart
Forum.
Trading Diary
December 19, 2002
These extracts from my daily trading diary are
intended to illustrate the techniques used in short-term trading
and should not be interpreted as investment advice. Full terms
and conditions can be found at Terms
of Use .
USA
The Dow trends down on increasing volume,
closing 1% lower at 8364. The down-trend may still re-test the
7500 and 7200 support levels, establishing a broad base.
The primary trend is down and will only reverse up if the average rises above 9130.
The Nasdaq Composite rallied at the opening, but soon lost impetus to close 0.5% down at 1354.
The primary trend is up.
The S&P 500 is down 7 points at 884. The index is ranging between 965 and 768, establishing a base.
The primary trend is down.
The Chartcraft NYSE Bullish % Indicator appears stuck at 50% (December 18).
Iraq
Market jitters increased when UN chief weapons inspector Hans Blix said that he is not satisfied with Iraq's weapons declaration and that it failed to answer many questions. (more)
Gold
New York: Spot gold continues to climb, up 120 cents at $US 345.30.
Market jitters increased when UN chief weapons inspector Hans Blix said that he is not satisfied with Iraq's weapons declaration and that it failed to answer many questions. (more)
Gold
New York: Spot gold continues to climb, up 120 cents at $US 345.30.
ASX Australia
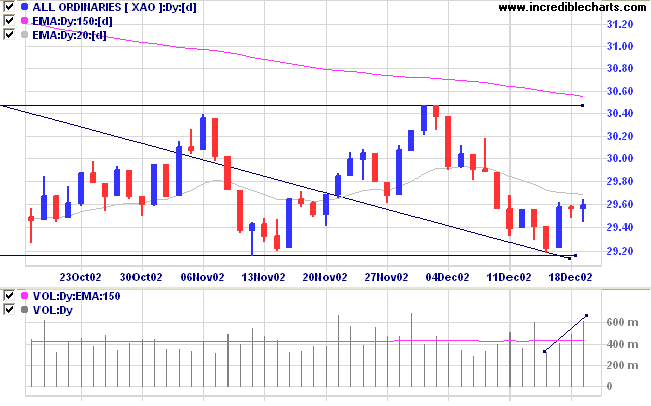
The All Ordinaries formed another doji, failing to confirm the
doji
star reversal from Thursday. The doji signals indecision
and a close below 2940 will still be bearish. The index closed
2 points up at 2959 on higher volume.
The market is ranging between 2915 and 3050, building a broad base in the process.
The Slow Stochastic (20,3,3) is above its' signal line; MACD (26,12,9) is below. Twiggs money flow is rising.
The market is ranging between 2915 and 3050, building a broad base in the process.
The Slow Stochastic (20,3,3) is above its' signal line; MACD (26,12,9) is below. Twiggs money flow is rising.
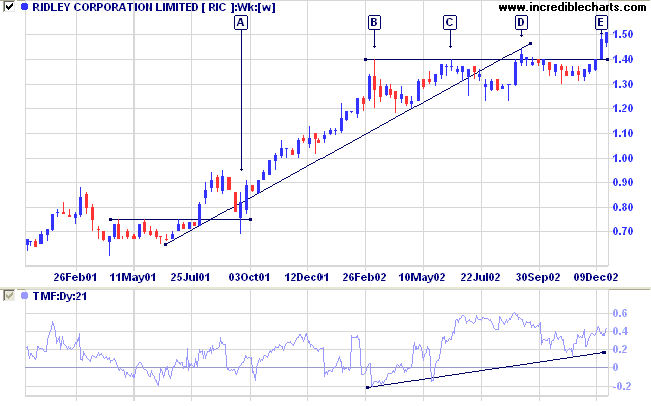
Ridley Corporation [RIC]
Last covered on September 05.
Last covered on September 05.
After a false downward break at [A] RIC entered a strong
up-trend before a sideways congestion pattern after [B]. Price
respected resistance at [C] before a false break at [D] and
then a more convincing breakout at [E]. Successive higher
troughs are a strong bullish signal - forming an ascending
triangle between [B] and [E].
Relative strength (price ratio: xao) and MACD are bullish. Twiggs Money Flow signals strong accumulation.
Relative strength (price ratio: xao) and MACD are bullish. Twiggs Money Flow signals strong accumulation.
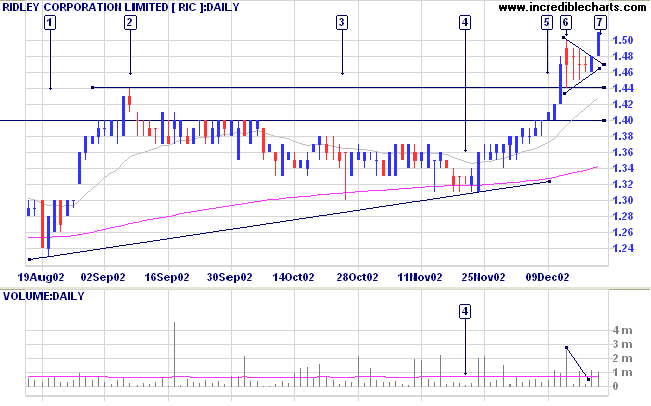
The false break at [D] can be seen at [2] on the daily chart -
note the low volume. Swing traders may have entered at [4]
after the successive higher troughs on the weekly chart. Volume
had tried up at the low [4] and on a narrow daily range. Entry
would be taken with a buy-stop above the day's high.
Longer-term traders may have entered at [5], when price broke
above resistance at 1.40. But RIC presented a further
opportunity when price formed a pennant after the high at [6].
Pennants and flags are strong continuation signals in a trend
and entry could be made on a break above the pennant at [7].
Again volume had dried up as the pennant formed, confirming the
pattern.
Going back to the weekly chart, the mid-point congestion
pattern at [B] to [E] points to a target of 2.10 (1.40 + (1.40
- 0.70)).
Market strategy
For further guidance see Understanding the Trading Diary.
For further guidance see Understanding the Trading Diary.
Short-term: Avoid new entries. The Slow Stochastic and MACD are
on opposite sides of their respective signal lines.
Medium-term: Avoid new entries.
Long-term: Wait for confirmation of the
bottom reversal signal.
Colin Twiggs
If we value independence,
if we are disturbed by the growing conformity of knowledge,
of values, of attitudes, which our present system induces,
then we may wish to set up conditions of learning which make for uniqueness,
for self-direction, and for self-initiated learning.
- Carl Rogers
if we are disturbed by the growing conformity of knowledge,
of values, of attitudes, which our present system induces,
then we may wish to set up conditions of learning which make for uniqueness,
for self-direction, and for self-initiated learning.
- Carl Rogers
Back Issues
Click here to access the
Trading Diary Archives.
Back Issues
Access the Trading Diary Archives.