Incredible Stock Charts now in your browser...
Improve your trading performance with amazing insights from stock charts featuring proprietary indicators and powerful stock screens.
Try it for Free!
Register now for a 30 Day Free Trial of the new browser version.
Why Incredible Charts?
Features include:
- ASX, NYSE, NASDAQ, OTC Markets, LSE and TSX stock exchange data
- Forex & precious metals
- Premium data, adjusted for corporate actions that distort indicator signals.
- More than 100 technical indicators, including:
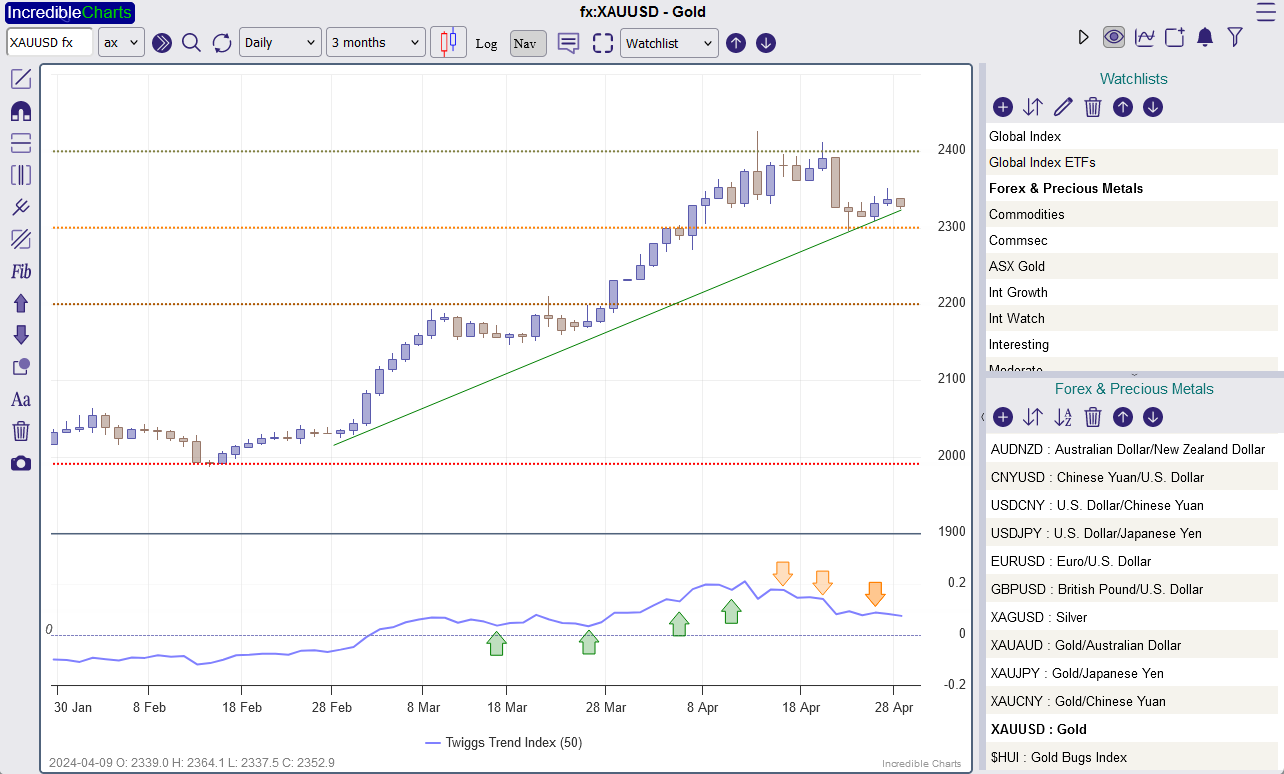
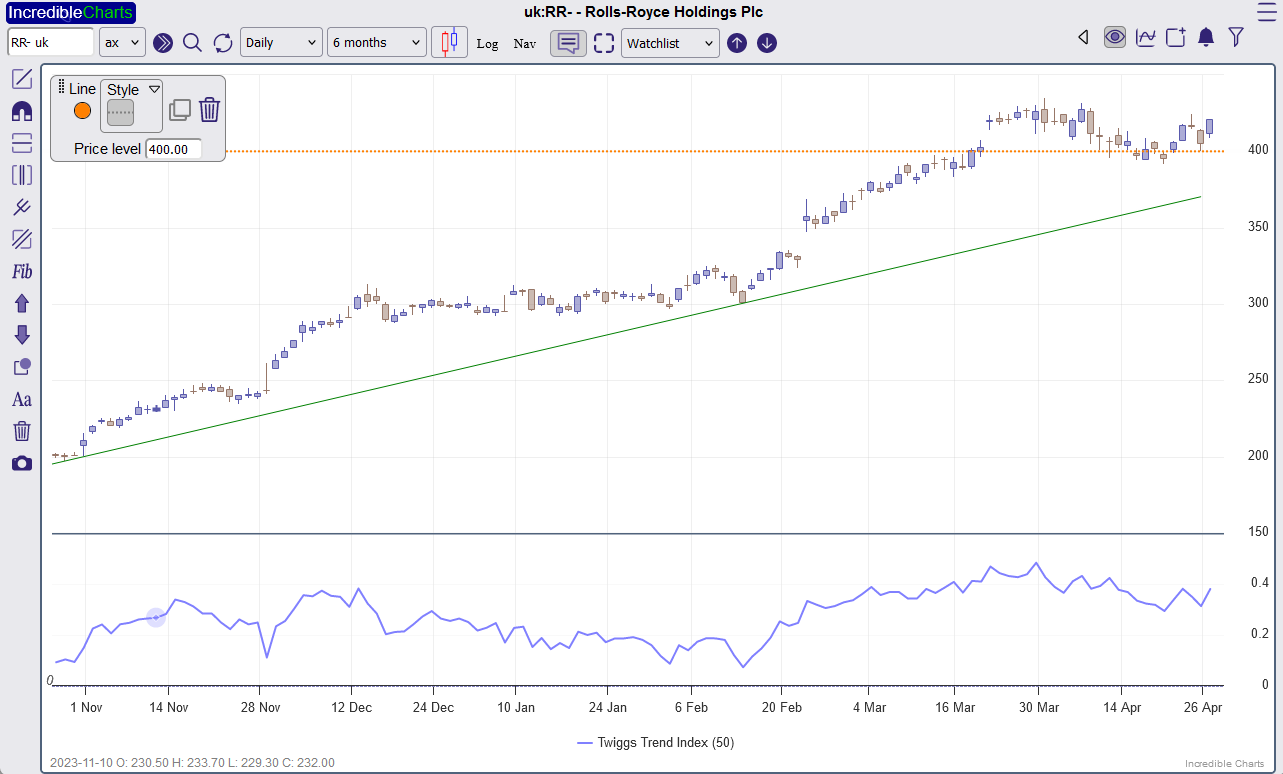
- Proprietary Twiggs® Money Flow, Trend Index and Twiggs® Momentum
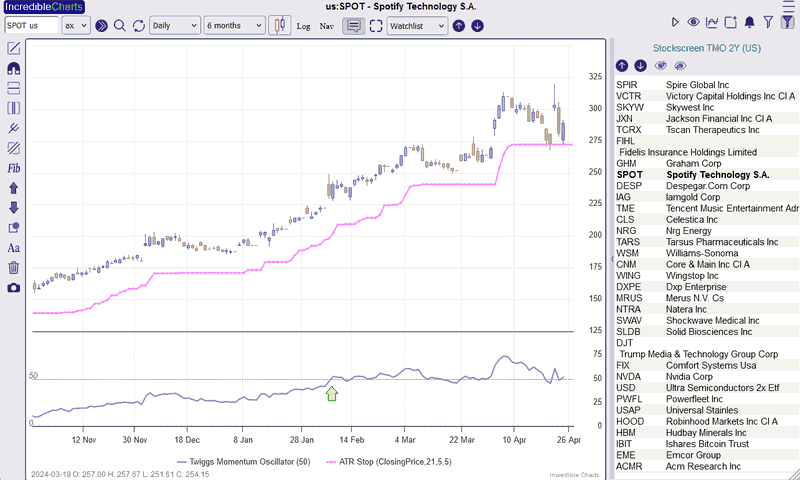
- Stop-loss systems: ATR Trailing Stops, Parabolic SAR, Chandelier Exits, Safzone and Volatility Stops
- Auto-fit trendlines and channels
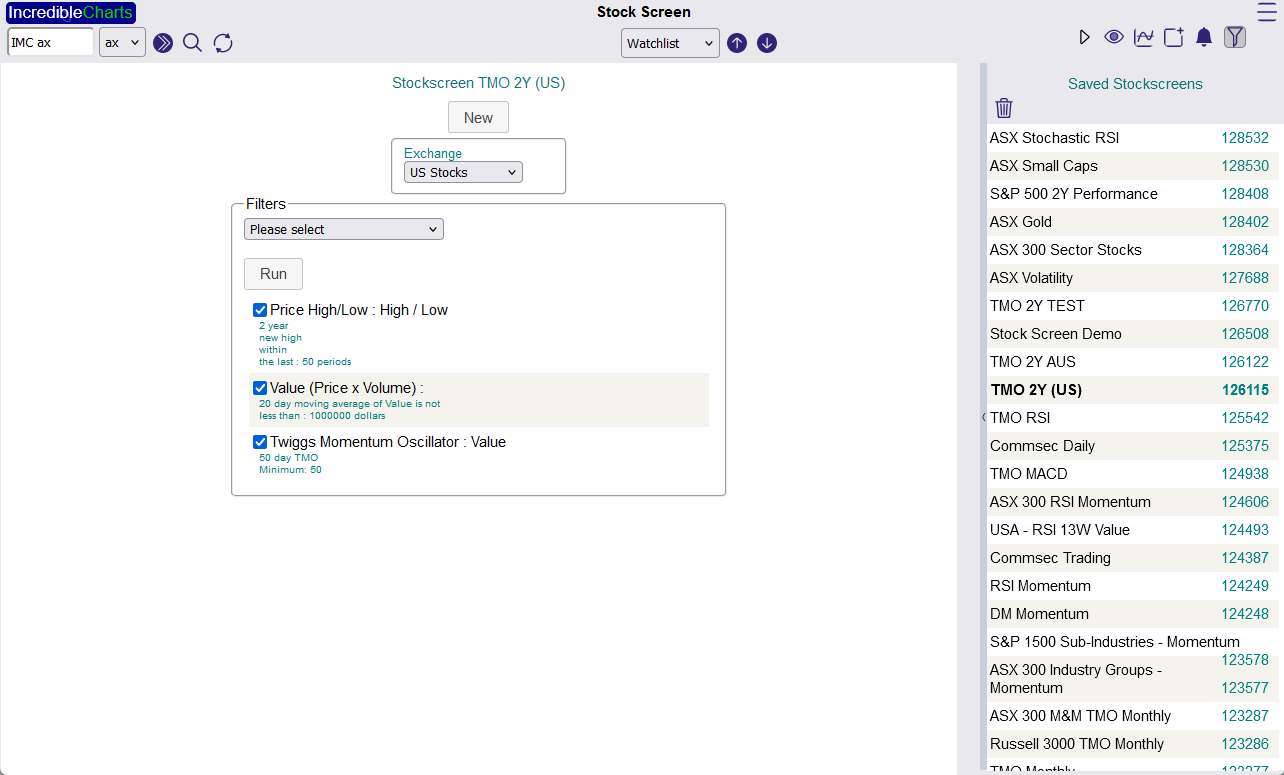
- Powerful stock screens with a wide array of technical filters
Classic Stock Charts - Download for Windows
Incredible Charts classic desktop charting package:
- Compatible with Windows Operating Systems
- Download and install on your PC
Try it for Free!
Register for a 5 Day Free Trial of the Classic Stock Charts.
Technical Education
- Technical Analysis >
Technical analysis is founded on three basic tenets from Dow Theory, underpinned by the concept of support and resistance. - Dow Theory >
Dow Theory lays out the basic principles of technical analysis, identifying trend changes as well as bull and bear markets. - Chart Patterns >
Chart Patterns are formed by support and resistance levels and by trend lines. - Candlestick Charts >
Candlestick chart patterns highlight trend weakness and reversal signals that may not be apparent on a normal bar chart. - Trading Strategy >
How to Develop a Trading Strategy in 9 Steps
Indicators
Technical indicators highlight a particular aspect of price or volume behavior on a stock chart to provide valuable insights and help with analysis.
Newcomers often great significance to the favourite indicators but none are infallible.
Keep it simple and select indicators that complement each other and are suited to current market conditions.
- Indicators: A Guide >
How To Use Technical Indicators as well as understand their strengths and weaknesses. - Indicator Signals >
Explains basic indicator and trend concepts: respect, whipsaws, divergence, and failure swings. - Indicators A to Z >
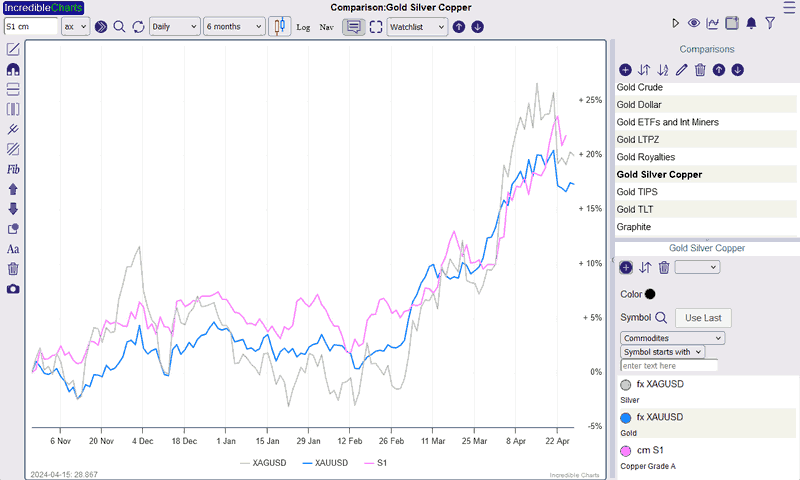
A complete reference guide of the indicators available with the Incredible Charts software. - How to Compare Stocks >
The new browser version includes a comparison tool to compare multiple stocks on a percentage axis. - Screen for Stocks using Technical Filters >
Identify trending, ranging or potential breakout stocks with the Stock Screener.
Popular Indicators
- MACD >
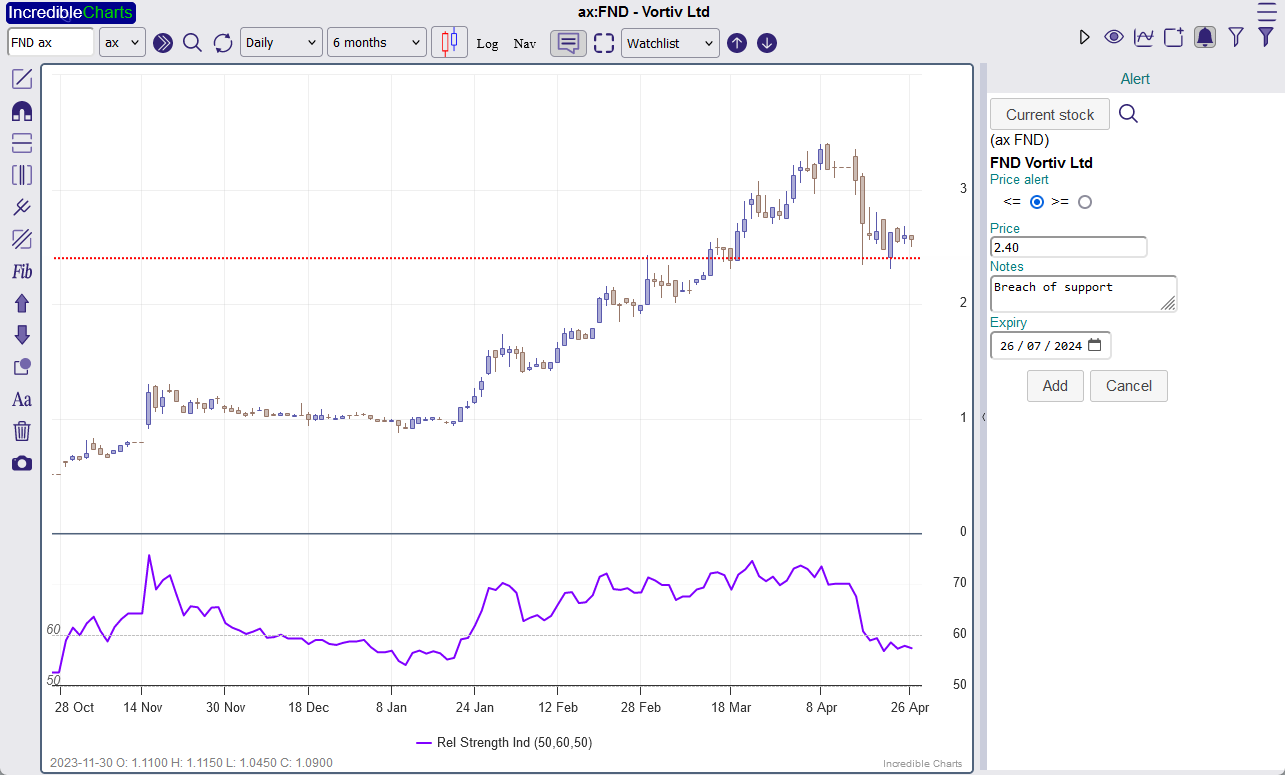
The MACD indicator is primarily used to trade trends and should not be used in a ranging market. - Relative Strength Index (RSI) >
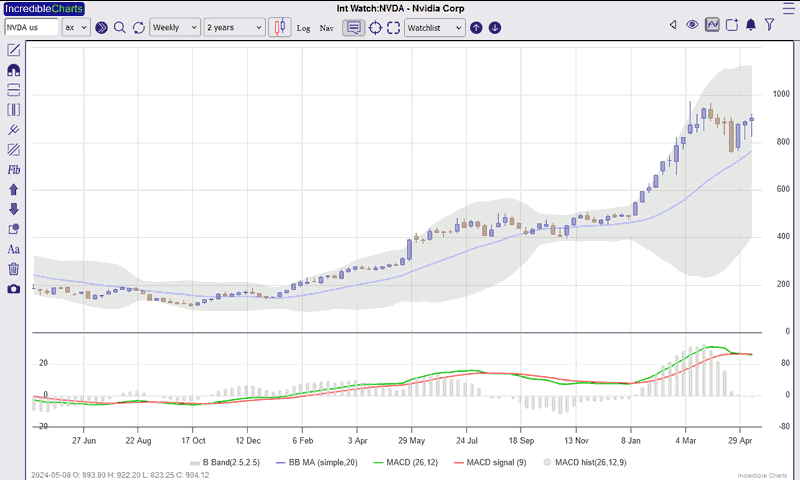
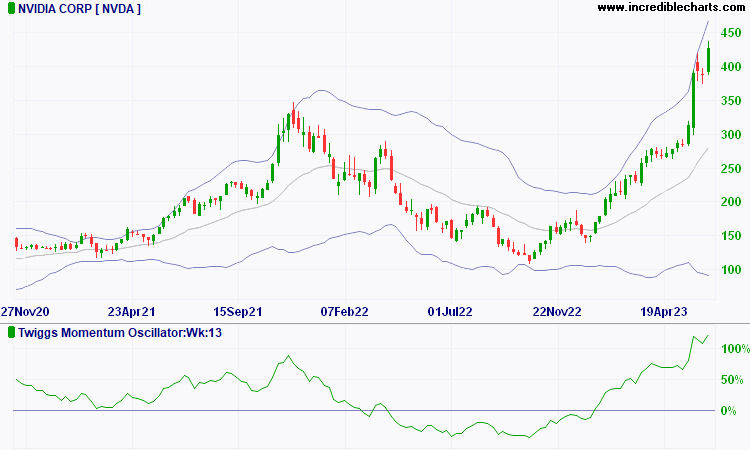
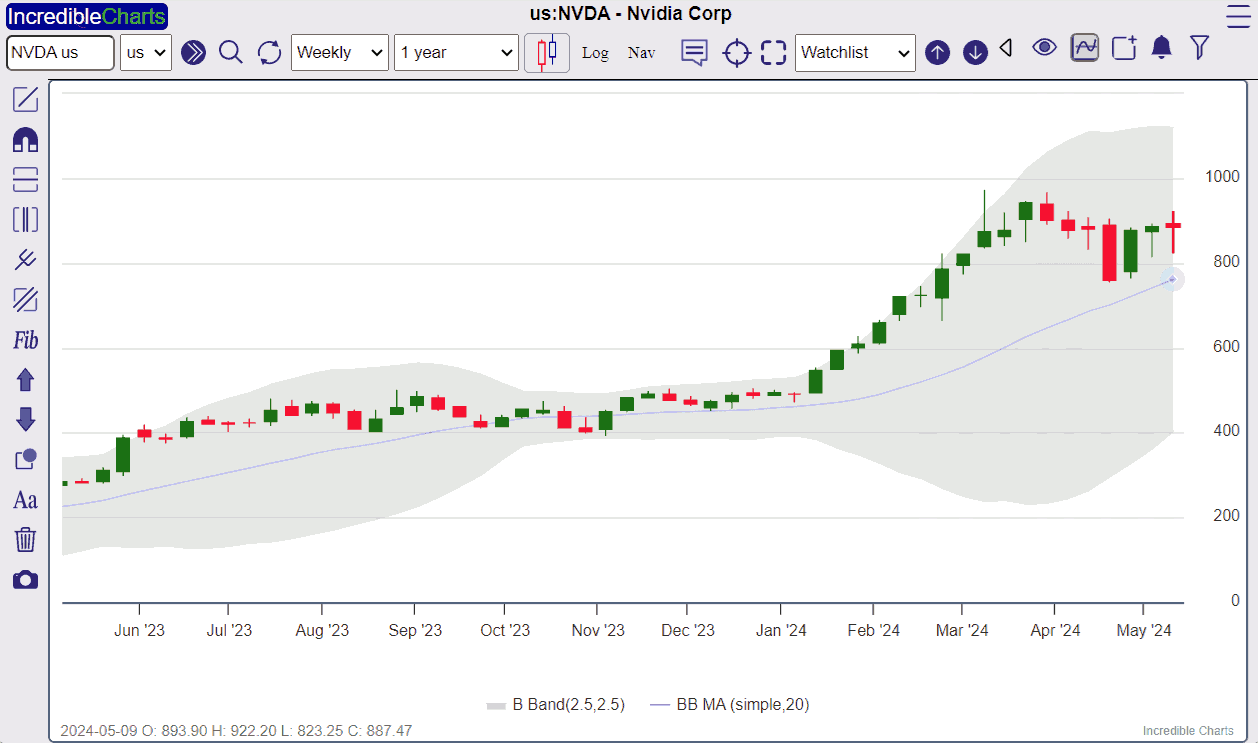
The Relative Strength Index (RSI) Indicator is a popular momentum oscillator that compares upward and downward movements in closing price. - Bollinger Bands >
Bollinger Bands® indicate overbought and oversold levels relative to a moving average. - Twiggs Money Flow >
Twiggs Money Flow warns of breakouts and provides useful trend confirmation. - Twiggs Momentum >
Twiggs Momentum Oscillator is a new momentum indicator developed by Colin Twiggs for Incredible Charts. A smoothed version of the Rate Of Change oscillator, its primary purpose is to identify fast trending stocks using the stock screener. - ATR Trailing Stop Loss >
ATR Trailing Stops are primarily used to protect capital and lock in profits on individual trades. - Moving Average >
Moving averages provide an objective measure of trend direction by smoothing price data.
Indicator Groups
- Volume Indicators >
Volume indicators are used to confirm the strength of trends. - Momentum Indicators >
Momentum Indicators are used to measure the fluctuation between overbought and oversold levels. - Trend Indicators >
Trend indicators measure trend direction. Moving averages, Directional Movement and MACD are three of the most popular trend indicators. - Volatility Indicators >
Along with volume, volatility can be used to confirm price behavior. - Twiggs Proprietary Indicators >
Designed by Colin Twiggs to highlight different aspects of buyer/seller sentiment or enthusiasm.
Trading Diary
Join our free newsletter service, including:
- Global Market Outlook
- Trading Ideas
- New Developments