How to Read Trends
Trend Attributes
In our discussion we will focus on uptrends and their attributes.
Downtrends share many of the same characteristics, just in reverse. They also tend to move a lot faster than uptrends, with steeper falls. Fear is a bigger motivator than greed.
Uptrends
Uptrends normally possess the following attributes:
- An initial surge in momentum as the stock breaks through resistance and establishes an uptrend.
 Breakout")
- Some stocks fail to hold above the new support level and the trend almost immediately collapses.
- Others establish an uptrend, with strong advances and weak corrections — the holy grail of trend-trading.
")
- Eventually, advances weaken and corrections grow stronger as the stock loses momentum.
- Finally, support is broken and the trend will reverse.

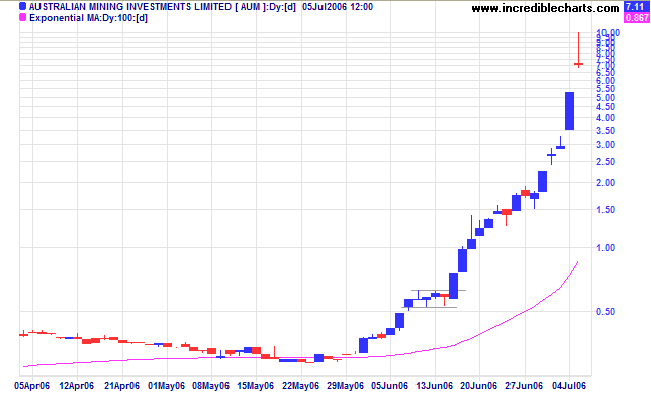
- Alternatively, advances will accelerate to an exponential uptrend — commonly known as a blow-off — followed by a steep drop as support gives way.
 Blowoff")
Conclusion
Uptrends normally display an initial surge in momentum. Some fail to hold above their new support level while others commence an uptrend with strong advances and weak corrections.
The trend draws to an end when corrections grow stronger and advances weaken or there is a blow-off, when advances accelerate exponentially followed by a sharp drop.
Trend Strength on a Stock Chart
There are three main indicators of the strength of a trend:
- Movement in the direction of the underlying trend;
- Correction or consolidation before the primary trend resumes; and
- Support and resistance at the preceding high.
Trend Movement
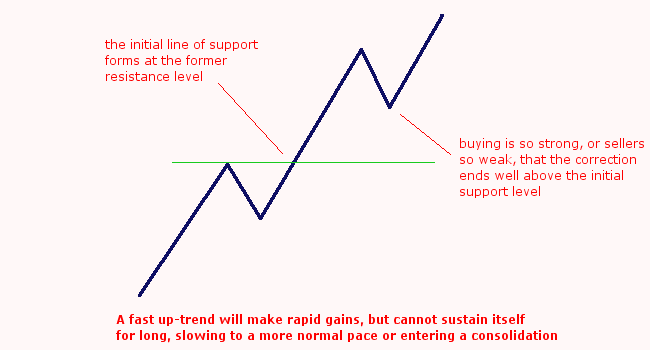
The magnitude of the move above the previous base indicates buyers' enthusiasm. The more bullish buyers are, the further they will be willing to venture above the safety net of the previous correction or consolidation.
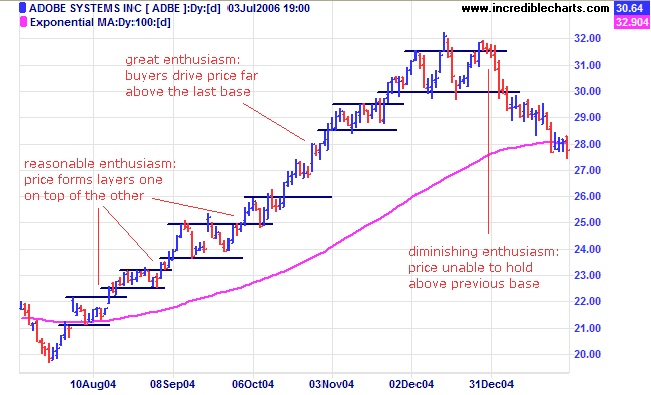
Buyers below have thrown caution to the winds. Spikes like this often end with a sharp reversal as there is no clear support level.
Correction or Consolidation
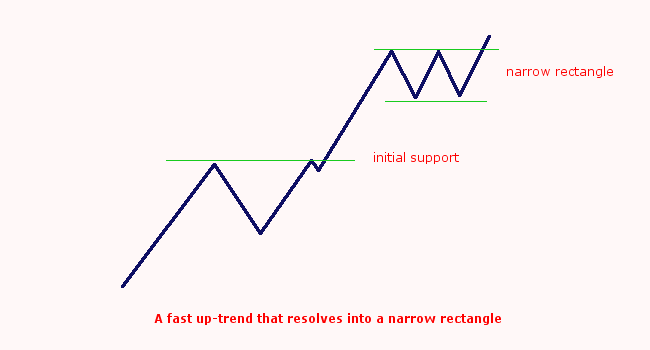
Short corrections and narrow consolidations also reflect trend strength. A short correction indicates that buyers have overwhelmed sellers or simply that sellers are disinterested. In either case this is a positive sign for the underlying trend.
Narrow consolidations or rectangles are similarly a bullish continuation signal in an up-trend. Sellers may be present in reasonable force but buying support is sufficient to prevent a correction.
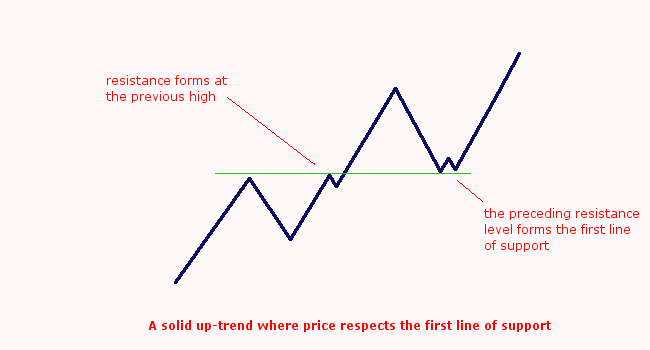
Support and Resistance
When price breaks above its preceding high, resistance at the earlier high becomes support for the new breakout, with buyers likely to accumulate should price retrace near the breakout level. The new support level will be relatively weak compared to support at the previous low; so when the new level holds it indicates a strong up-trend.
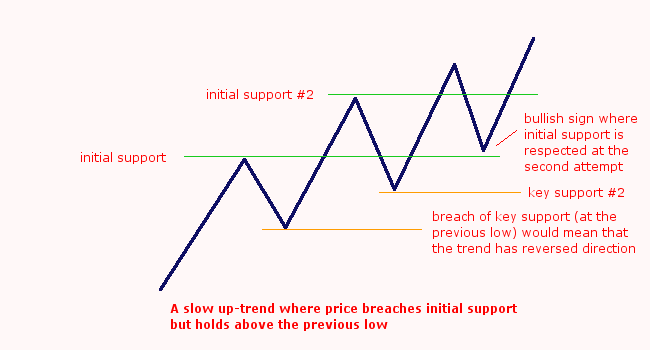
Weaker Support
If initial support does not hold at the first attempt, buyers and sellers may be more evenly matched and the up-trend is likely to be slower and more uncertain. If price later respects the initial support level, that is a sign that trend strength may be increasing.
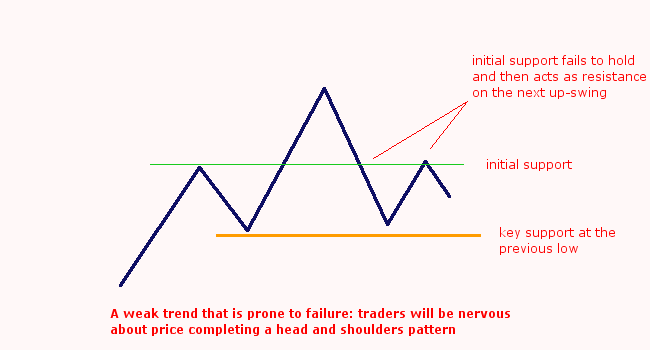
Support Becomes Resistance
If the initial support level is breached and then acts as resistance on the next up-swing, the trend is precarious. Any penetration of key support (from the previous low) would complete a head and shoulders reversal, triggering a spate of selling.
Summary
Most traders will want to trade fast or reliable trends, where retracements respect the initial line of support. Slow up-trends can be traded in a similar fashion to a ranging market, using swing trading tactics, while I do not suggest that you trade weak trends at all.

Author: Colin Twiggs is a former investment banker with almost 40 years of experience in financial markets. He co-founded Incredible Charts and writes the popular Trading Diary and Patient Investor newsletters.
Using a top-down approach, Colin identifies key macro trends in the global economy before evaluating selected opportunities using a combination of fundamental and technical analysis.
Focusing on interest rates and financial market liquidity as primary drivers of the economic cycle, he warned of the 2008/2009 and 2020 bear markets well ahead of actual events.
He founded PVT Capital (AFSL No. 546090) in May 2023, which offers investment strategy and advice to wholesale clients.