Bullish Percent Index
Thomas Dorsey identifies the NYSE Bullish Percent Index in Point
& Figure Charting.
Developed by Chartcraft for the NYSE, the index can be applied to any market.
The index is based on the percentage of stocks on the exchange showing buy signals:
- Each individual stock is charted on a Point & Figure chart (using a 2 percent logarithmic scale and a 3 box reversal), and
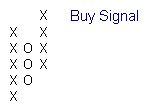
- Buy signals are taken as any column of X's that is higher than the previous column of X's.
The index itself is plotted on a Point & Figure chart with overbought level at 70 per cent and oversold level at 30 per cent. Boxes are fixed at 2 per cent and the reversal amount is 3 boxes (6 per cent).
Bull Confirmed Market
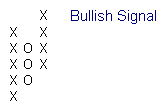
This signals the trader to go long when a column of X's on the index chart exceeds a previous column - the same as the buy signal on an individual chart.
The closer the signal is to the oversold level, the stronger the signal. Likewise, a signal close to the overbought level is weak.
Bear Confirmed
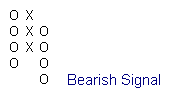
A column of O's falls below the previous column of O's. The closer to the overbought level the stronger the signal. Go short.
Bull Alert Market
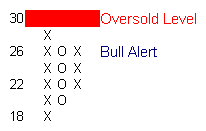
When the index starts a new column of X's below the oversold level (remember that a new column is only started when price has reversed by 3 boxes). Take long positions but with caution.
Bear Alert
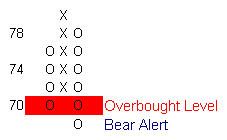
A new column of O's is started above 70 and drops to below the overbought level - without falling below the low of the previous column of O's. Take short positions but with caution.
Bull Correction
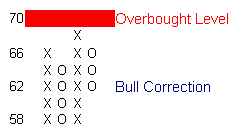
The index pulls back by 6 per cent after a Bull Confirmed signal. This may take place above or below the overbought level but must not cross the critical 70 per cent level. This indicates that the bull market is losing steam but does not indicate a reversal. Prepare to buy on the next rally that carries above 6 per cent.
Bear Correction
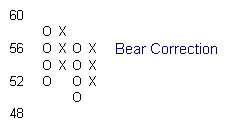
This indicates that the bear market is re-grouping but it is not a reversal signal. Prepare to go short on the next correction that starts a new column of O's.

Author: Colin Twiggs is a former investment banker with almost 40 years of experience in financial markets. He co-founded Incredible Charts and writes the popular Trading Diary and Patient Investor newsletters.
Using a top-down approach, Colin identifies key macro trends in the global economy before evaluating selected opportunities using a combination of fundamental and technical analysis.
Focusing on interest rates and financial market liquidity as primary drivers of the economic cycle, he warned of the 2008/2009 and 2020 bear markets well ahead of actual events.
He founded PVT Capital (AFSL No. 546090) in May 2023, which offers investment strategy and advice to wholesale clients.