Screen for Bear Traps
Summary
- Bear traps are a great bull signal, suitable for trading in short or intermediate time frames.
- A bear trap occurs when price breaks through a support level but quickly reverses.
- Our aim is to identify bear traps that occur in an uptrend.
- Use a stock screen with a moving average crossover and long-term momentum.
Bear traps occur when price breaks through a significant support level, but then quickly reverses when stops triggered are mopped up by ready buyers. Recovery above the former support level completes a bear trap reversal.
To identify bear traps, run a stock screen with three filters:
- Moving Average - Crossover, where closing price crosses above the 200-day exponential moving average within the past 20 days;
- Twiggs Momentum - Value, where 100-day TMO is above 10; and
- Value (Price x Volume), where 20-day average volume is above $2 million.
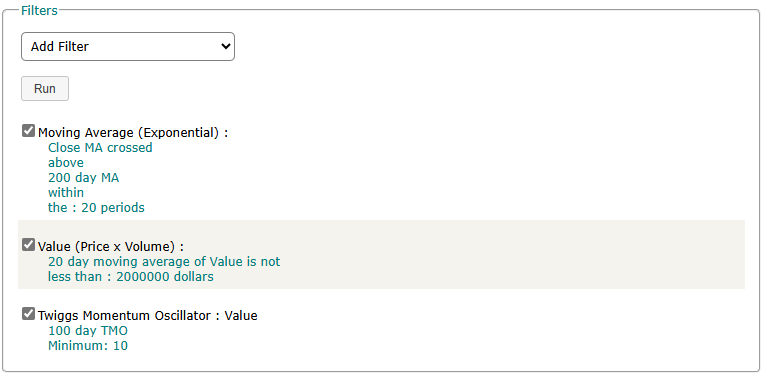
The MA crossover filters for recent reversals, Twiggs Momentum for trend strength, and Value eliminates thinly traded stocks.
Variations
Experiment with:
- A shorter MA crossover period of say 5 days to capture only the most recent reversals
- Different length moving averages (e.g. 100-day or 150-day) to see if this turns up more opportunities.
- Increase the Value filter if you want to focus on stocks with larger market capitalization. Alternatively, use an index filter such as the ASX 200.
Stock Screen Results
Click on the EMA header to sort results starting with the most recent crossovers.

Scroll through the charts using the up/down arrows on the menu and scan for suitable bear traps:
- A significant support level, preferably at a round number. See Support and Resistance to learn more.
- Look for a break below the support level followed by a quick reversal, ideally within a few days, that completes the bear trap. See Bear Traps to learn about trade setups.
Example: Suncorp Group Ltd (SUN)
Suncorp Group Ltd (SUN) briefly broke support at 20.00 in August, followed by a quick recovery the following day.
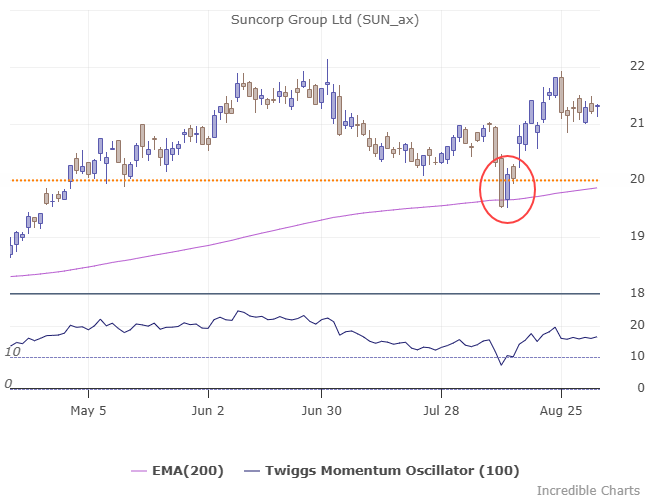
The SUN bear trap presents a trading opportunity. Set a tight stop loss just below the 20.00 support level (e.g. 19.80). Set a target at the next significant resistance level (e.g. 21.00) or lock in profits with a trailing stop below recent lows.
Conclusion
Bear traps are an underrated bull signal that presents profitable trading opportunities. They can be identified using a stock screen with filters for recent Exponential Moving Average Crossovers and long-term Twiggs Momentum.

Author: Colin Twiggs is a former investment banker with almost 40 years of experience in financial markets. He co-founded Incredible Charts and writes the popular Trading Diary and Patient Investor newsletters.
Using a top-down approach, Colin identifies key macro trends in the global economy before evaluating selected opportunities using a combination of fundamental and technical analysis.
Focusing on interest rates and financial market liquidity as primary drivers of the economic cycle, he warned of the 2008/2009 and 2020 bear markets well ahead of actual events.
He founded PVT Capital (AFSL No. 546090) in May 2023, which offers investment strategy and advice to wholesale clients.