Pivot Points
Pivot points are useful for identifying significant support and resistance levels and for identifying bearish or bullish market sentiment. Pivot Points were popularized by exchange floor traders who needed short-term predictive tools which can be adapted in a fast-moving trading environment. Pivot Points and support and resistance levels are calculated at the start of each day, based on the high, low and close of the previous day, and are used to guide trading strategy through the day.
Trading Signals
The Pivot Point is the strongest support/resistance level, with weaker levels at S1, S2 and R1, R2. The same level will act as support when price descends from above and as resistance if approached from below.
Example
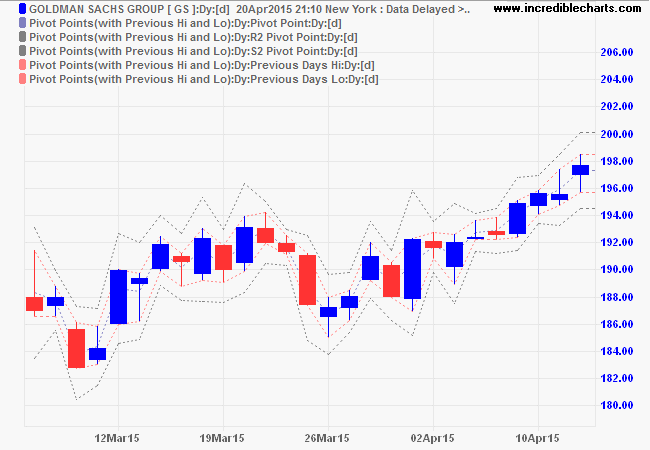
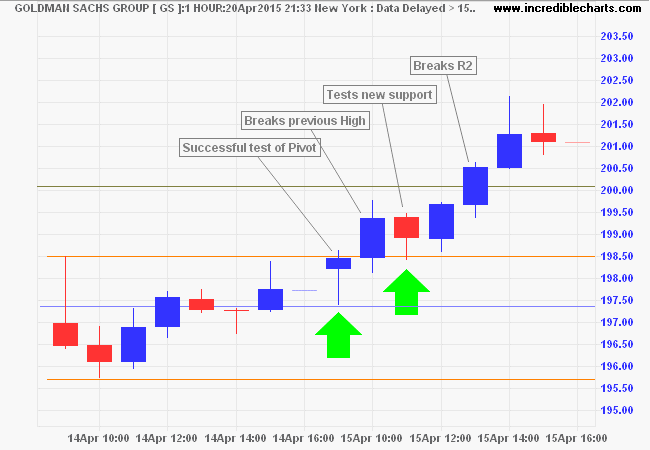
Goldman Sachs Group (GS) Pivot Point is calculated as 197.307 using the High, Low and Close from April 14th, 2015. Secondary levels are the High and Low from the 14th and R2 and S2 as explained below.
Trading for the 15th is reflected on an hourly chart. Price opens near the previous High before retracing to test support at the Pivot Point. Respect of support sets a bullish tone for the day's trading and is followed by a break of resistance at the previous day's High. Resistance then becomes support as the previous High is successfully tested, signaling further gains. The advance then breaks resistance at R2 before ending with profit-taking (tall shadows/wicks on the last two candles) at the close.
Setup
- Select
Indicators in the chart menu. - Select Pivot Points in the left column of the Indicator Panel.
- Choose between the two options:
- Standard (with R1 and S1); or
- Recommended (with Previous High and Low).
- Plot (Daily) and Pivot Range (Daily) should be left as standard for most purposes.
- Save indicator to the right column [>>].
See Indicator Panel for further directions.
Pivot Point Formula
Several methods of calculating Pivot Points have evolved over the years, but we will stick to the Standard Method:
- The Pivot Point is the average of the previous High, Low and Closing Price.
- Resistance level 2 (R2) = Pivot Point + High - Low
- Resistance level 1 (R1) = Pivot Point x 2 - Low
- Support level 1 (S1) = Pivot Point x 2 - High
- Support level 2 (S2) = Pivot Point - High + Low
I prefer to use the High and Low for the previous period in place of R1 and S1. The two sets of levels are reasonably close, but Previous High and Low is simpler and less contrived. This is offered as an alternative to the Standard Version with R1 and S1 on the indicator panel.

Author: Colin Twiggs is a former investment banker with almost 40 years of experience in financial markets. He co-founded Incredible Charts and writes the popular Trading Diary and Patient Investor newsletters.
Using a top-down approach, Colin identifies key macro trends in the global economy before evaluating selected opportunities using a combination of fundamental and technical analysis.
Focusing on interest rates and financial market liquidity as primary drivers of the economic cycle, he warned of the 2008/2009 and 2020 bear markets well ahead of actual events.
He founded PVT Capital (AFSL No. 546090) in May 2023, which offers investment strategy and advice to wholesale clients.