Donchian Channels
Donchian channels were developed by Richard Donchian, a pioneer of mechanical trend following systems. The two outer bands are plotted as the highest high and lowest low for a set period, originally 20 days, with the optional middle band calculated as the average of the two.
Donchian Channel Trading Signals
The system is only suitable for trending markets.
Donchian's Four Week Rule
- Go long when price crosses the upper Donchian Channel (the four week high if 20 days is used).
- Go short when price crosses the lower Donchian Channel.
- If trading futures, roll forward any open positions into the next contract on the last day of the month preceding expiration.
The objective is to enter the trend on a breakout and to ride the trend for as long as possible, avoiding shakeouts.
Turtle Trading
Curtis Faith in his book Way Of The Turtle describes a variation of the Donchian system used by the legendary Turtle Traders.
- Enter long when price crosses above the 20-Day upper Donchian Channel and exit when price penetrates a 10-Day lower Donchian Channel.
- Enter short when price crosses below the 20-Day lower Donchian Channel and exit when price penetrates a 10-Day upper Donchian Channel.
- Use the 25-Day/350-Day exponential moving average as a trend filter. Go long only if the 25-Day EMA is above the 350-Day exponential moving average and go short only where below the 350-Day EMA.
The system also uses ATR trailing stops with a multiple of 2. Faith, however, demonstrates that replacing the 10-Day Donchian Channel and ATR stops with a simple time-based exit, where all trades are exited after 80 days (16 weeks), achieves similar results — with no stop losses at all.
Example
Goldman Sachs displays the Turtle Trading settings for an up-trend, 20-day upper and 10-day lower Donchian Channels, with 63-day exponential moving average as an added trend filter.
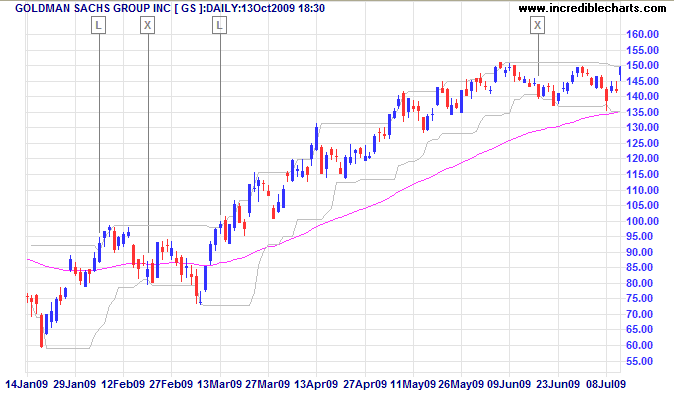
Mouse over chart captions to display trading signals.
- Go long [L] when price crosses above the upper Donchian Channel while above the 63-day exponential moving average
- Exit [X] when price crosses the lower Donchian Channel
- Go long [L] when price recovers above the upper Donchian Channel
- Exit [X] when price crosses below the lower channel.
Setup
The default setting for both Donchian Channels is 20 days. The middle line is optional.
See Indicator Panel for directions on how to set up an indicator — and Edit Indicator Settings to change the settings.
Donchian Channel Formula
- The upper band is calculated as the highest high for the selected period.
- The lower band is calculated as the lowest low for the selected period.
- The selected period does not include the day on which the band is plotted (otherwise the band would never be crossed). For example, the 20-Day Donchian Channels for today are the highest high and lowest low for the preceding 20 trading days.
- The middle line is calculated as (Upper Band + Lower Band) / 2.
Evaluation
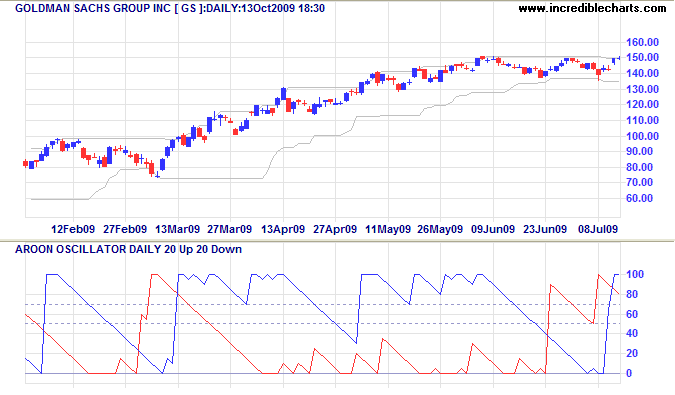
Donchian Channels and the Aroon Oscillator give identical signals. Aroon records 100% when price breaks the Donchian Channel. Readers should choose whichever format they feel most comfortable with.

Author: Colin Twiggs is a former investment banker with almost 40 years of experience in financial markets. He co-founded Incredible Charts and writes the popular Trading Diary and Patient Investor newsletters.
Using a top-down approach, Colin identifies key macro trends in the global economy before evaluating selected opportunities using a combination of fundamental and technical analysis.
Focusing on interest rates and financial market liquidity as primary drivers of the economic cycle, he warned of the 2008/2009 and 2020 bear markets well ahead of actual events.
He founded PVT Capital (AFSL No. 546090) in May 2023, which offers investment strategy and advice to wholesale clients.