Volume Spikes and Dips
There are two times where daily volume will highlight unusual trading activity:
- Volume may spike above the normal range, signaling unusual trading interest; and
- Volume may also dip below the normal range, indicating a lack of trading interest.
Both of these signals are important and can forewarn of future price movement.
Identifying Unusual Volume
Readers of the Trading Diary will notice that I frequently use a method, learned from Bill McLaren (author of Foundations for Successful Trading), to quickly identify unusual volume.
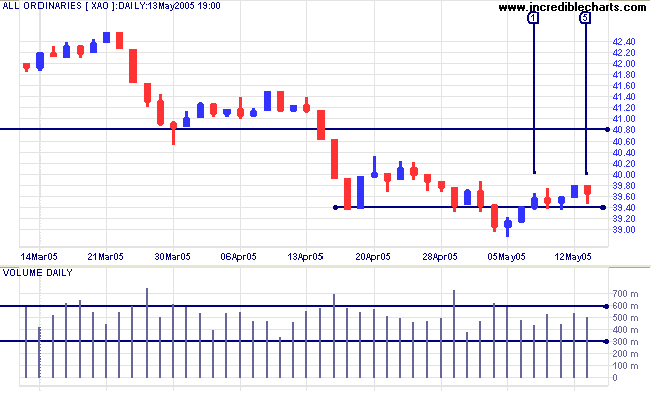
Two horizontal lines are visually fitted over Volume, separating volume bars into three categories:
- above the top line = unusual activity
- between the lines = normal activity (daily bars can be largely ignored but one should still watch for trends: increasing or decreasing volume over a week or more)
- below the bottom line = unusually low activity (where volume has dried up)
Hints
- Fit the lines based on the last year's volume and extend them forward each week when you review the chart;
- Ensure that the top line will highlight at least one volume bar in each quarter;
- Likewise with the bottom line;
- Too many signals on the other hand will negate their usefulness - set an upper limit of 40 or 50.
I would have missed a number of decent signals, in April/May on the above chart, if I had raised the upper line to 1.5 million.
Cautions
- Occasionally volume spikes are the result of a single large institutional transaction. The actual deal may have been negotiated over several weeks and has little relevance to the course of sales on the day on which it is booked. If volume is 5 or 10 times the daily average, you need to establish whether it was caused by a single transaction.
- Be careful not to confuse low trading volume with the lull in activity generally experienced over Christmas, Easter and prior to most long weekends.
- Volume spikes on triple-witching days (especially on indexes and major stocks) should be treated with caution.
Trading Signals
Price and Volume Spike
In a strong established trend, large price and volume spikes often precede a major reversal: the security has either been substantially overbought or oversold and market professionals step in and buy/sell against the trend.
Up-Trend
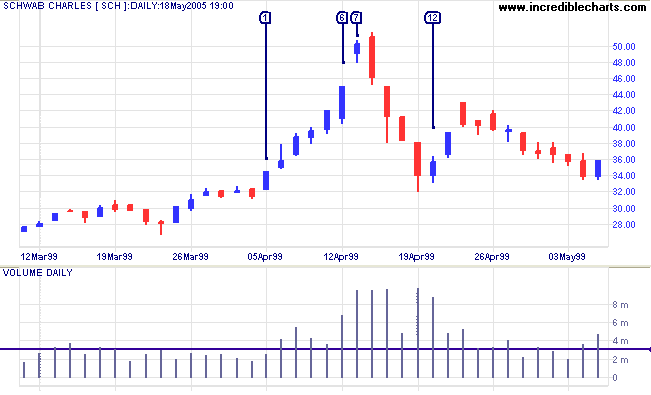
The Charles Schwab chart (above) shows a classic blow-off pattern in an up-trend. The long-established trend started to accelerate at [1]. Day [2] displays a tall shadow and huge volume, signaling profit-taking. A wide-ranging day at [6] leaves a tall blue candle with even higher volume -- a typical blow-off signal. The gap on day [7] is another classic blow-off sign -- see exhaustion gaps. Daily volume now approaches a massive 10 million as the big money steps in, selling the stock down almost 40% over the next 4 days. A narrower blue candle and strong volume at [12] signal the start of a rally but buying demand has been absorbed and the rally fizzles out, commencing a primary down-trend.
Down-Trend
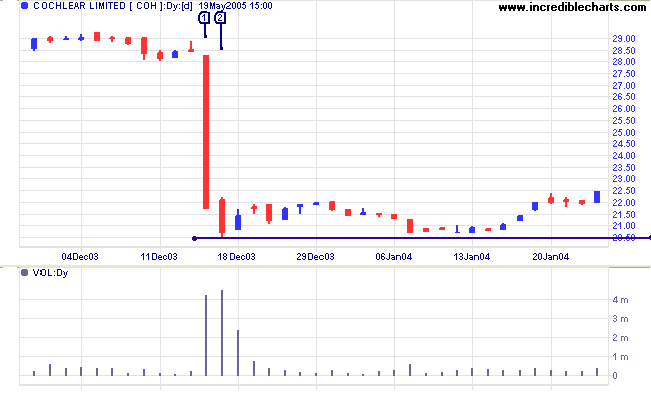
In a strong down-trend, a wide ranging day [1] accompanied by a volume spike signals the transfer of large amounts of stock from weak to strong hands, establishing a strong support level. Australian ear implant specialist Cochlear fell sharply in 2002 before forming a broad base in 2003 until a fall below the $30 support level eventually triggered panic selling (the "abandonment of all hope" mentioned by Charles Dow). The stock fell sharply on day [1] on huge volume. Compare the trading range to day [2] which showed even higher volume as large buyers, perceiving real value, started buying against the trend, establishing a strong support level at $20.
Trading Range
In a trading range, large volumes on a wide-ranging day will signal the likely direction of a breakout.
Compressed Spring
In a reaction during a trend, a volume spike combined with a narrow trading range often precedes a big move in the direction of the trend; committed opposition (to the reaction) having compressed the trading range.
A similar (though weaker) signal is offered by a volume spike accompanied by a candle with a long tail.
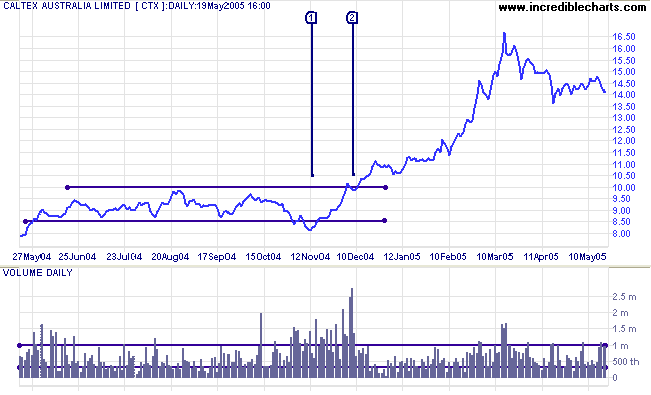
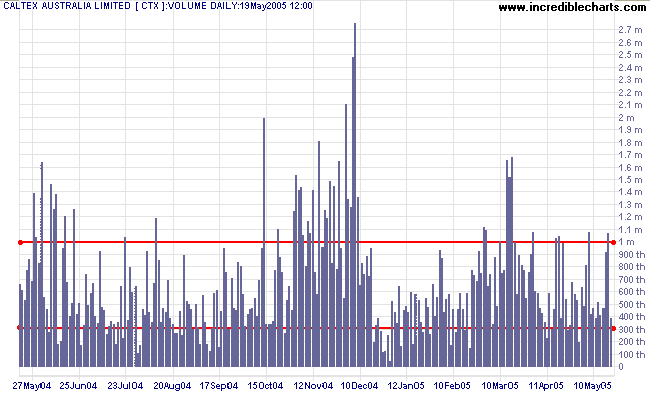
Caltex Australia consolidated in a band between 8.50 and 10.00 for about 6 months, following a strong up-trend, before exhibiting two classic buy signals:
- a bear trap [1] at the lower border of the consolidation; followed by
- a small scallop below resistance at [2].
What is remarkable is the volume on the scallop at [2]. The equivolume chart below depicts volume by the width of the bars (open and close are reflected in a similar manner to candlesticks).
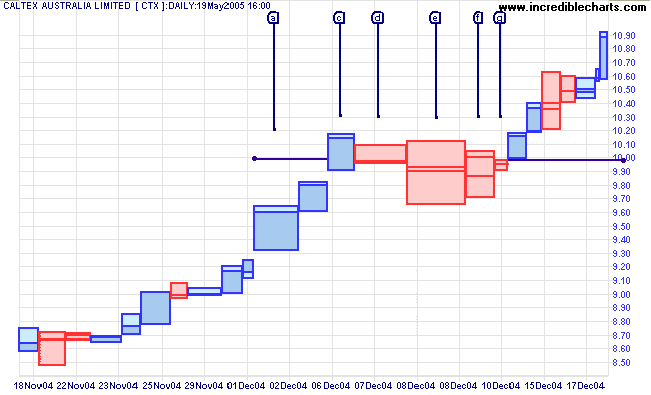
Profit-taking is evident at [a] as price again approaches resistance at 10.00. Price penetrates resistance at [c], triggering committed selling. The narrow range and huge volume at [d] alert us to the presence of strong buying, absorbing all stock that profit-takers offer in the market. Day [e] is looser, with a wider range but narrow body resembling a doji candle, on even larger volume. Selling pressure abates somewhat at [f] before a complete dry-up of trading activity at [g] signals that sellers are exhausted and a rally is imminent.
Trading Dries Up
A shallow correction/reaction in the form of a scallop, such as the one on the above Caltex Australia chart, is a bullish sign in an up-trend (or bearish in a down-trend). The best signal that the primary trend movement is about to resume is a narrow ranging day on unusually low volume, indicating that selling (or buying) pressure has abated.
This page has two examples:
- at [g] in the Caltex equivolume chart above; and
- at [4] in the Brambles chart below.
Reactions
A sharper reaction against the trend can still offer good buy signals (or sell signals in a down-trend), provided that the reaction is of short duration and ends with a long tail or reversal signal accompanied by a volume spike.
Gaps
Gaps accompanied by a volume spike often provide major signals. Earlier we saw a prominent exhaustion gap [7] during a blow-off on the Charles Schwab chart. The Brambles chart below provides two excellent examples:
- an exhaustion gap during a cathartic sell-off at [1]; and
- a breakaway gap accompanied by another volume spike at [3].
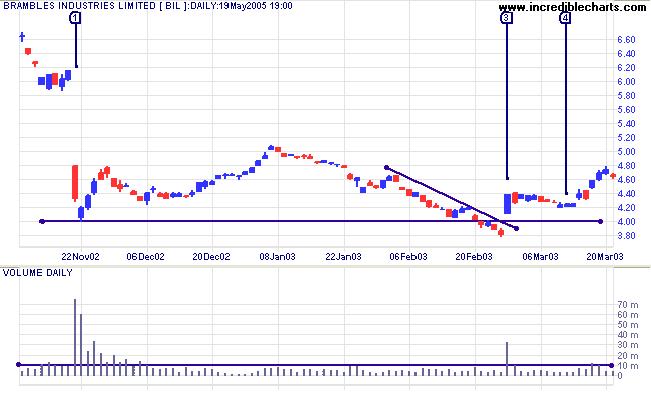
- The large downward exhaustion gap is accompanied by massive volume as sellers abandon hope.
- By the next day market professionals, having spotted real value, are buying in the face of the down-trend, mopping up all available stock at keen prices.
- Three months later price again tests $4.00 after drifting lower. The stock actually penetrates the support level before gapping upwards accompanied by a volume spike at [3]. Sometimes referred to as a hole-in-the-wall gap, a strong bull signal is made when price gaps to above a downward trendline. In the above case, price also gaps above the support/resistance, adding extra weight to the signal.
- Volume and trading range dry up on a shallow retracement.
Breakouts
A volume spike immediately after a breakout signals a healthy trend. Absence of volume signals weakness.

Author: Colin Twiggs is a former investment banker with almost 40 years of experience in financial markets. He co-founded Incredible Charts and writes the popular Trading Diary and Patient Investor newsletters.
Using a top-down approach, Colin identifies key macro trends in the global economy before evaluating selected opportunities using a combination of fundamental and technical analysis.
Focusing on interest rates and financial market liquidity as primary drivers of the economic cycle, he warned of the 2008/2009 and 2020 bear markets well ahead of actual events.
He founded PVT Capital (AFSL No. 546090) in May 2023, which offers investment strategy and advice to wholesale clients.