Triangle and Wedge Patterns
Triangles and wedges are longer-term patterns, often witnessed on weekly charts. They can be powerful continuation or reversal patterns, depending on their shape and whether they are situated in an up- or down-trend.
A strong preceding trend makes a stronger signal.
Triangle Patterns
There are 3 basic shapes:
Symmetrical Triangle
Symmetrical triangles form with lower highs and higher lows. Because of their shape, they can act as either a continuation or a reversal pattern. This will be signaled by the breakout. An upward breakout is a bullish signal, while a downward breakout is bearish.
Ascending Triangle
An ascending triangle is formed by equal highs and higher lows. It is a bullish signal, whether encountered in an up- or down-trend. It is most often observed as a continuation pattern in an up-trend but is a strong reversal signal when witnessed in a down-trend.
Descending Triangle
Descending triangles form with equal lows and lower highs. A bearish signal, the pattern is normally observed as a continuation pattern in a down-trend but can be a powerful reversal signal when encountered in an up-trend.
Example
Cochlear Limited (Australia) depicts 2 triangles and a falling wedge.
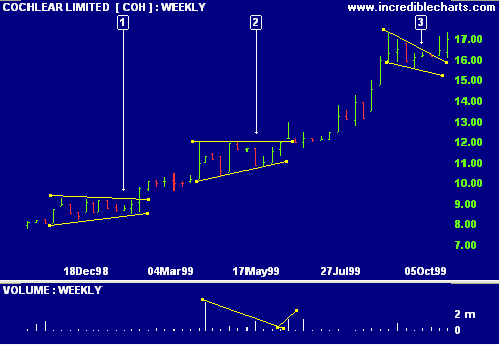
- Symmetrical triangle with lower highs and higher lows.
- Ascending triangle with equal highs and higher lows. Note that volume expands at the start of the triangle, decreases as the triangle forms and expands at the breakout.
- Falling wedge with lower highs and lower lows.
Target Measurement
The targeted move for a triangle is measured vertically at the start of the triangle: from the first trough or peak to the opposite border of the triangle. The move is then projected vertically from the point of breakout to the actual target.
Example
Foodland Associated Limited (Australia) shows a symmetrical triangle in an up-trend.
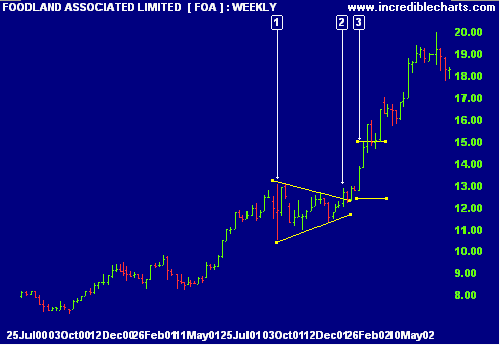
- The targeted move is measured from the trough at [1] vertically
to the opposite border:
Move = 13.07 - 10.50 = 2.57 - The move is then projected from the point of breakout at [2].
- The target is calculated as the value at the breakout point [2]
plus the move:
Target = 12.42 + 2.57 = 14.99
Example
Coles Myer Limited (Australia) exhibits a good example of a descending triangle after a strong up-trend.
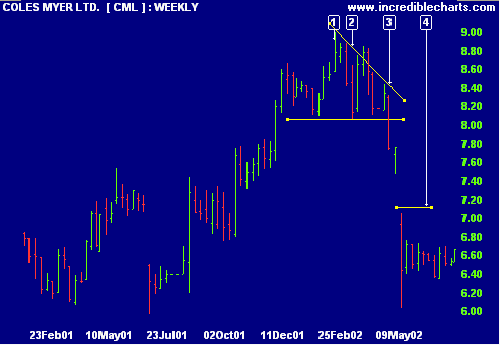
- The targeted move is measured from the first peak [1] to
the base of the triangle:
Move = 9.00 - 8.06 = 0.94 - The triangle base is at 8.06, the low from [2].
- The move is then projected from the point of breakout at [3].
- The target is calculated as the value at the breakout point
minus the move:
Target = 8.06 - 0.94 = 7.12
Wedge Patterns
There are 2 basic shapes, both with converging highs and lows:
Falling Wedge
A falling wedge forms with lower highs and lower lows. A bullish signal, a falling wedge is a continuation signal in an up-trend and a reversal signal when observed in a down-trend.
Rising Wedge
A rising wedge is formed by higher highs and higher lows. A bearish signal, the pattern is normally a continuation signal in a down-trend but acts as a reversal signal when encountered in an up-trend.
Target Measurement
The target for a continuation pattern is measured in a similar fashion to a flag or pennant.
The target for a reversal pattern is calculated from the highest peak to the lowest trough in the wedge pattern. The objective is calculated by projecting the target up/down from the breakout point.
Example
CSL Limited exhibits a number of wedge and triangle patterns. The largest rising wedge [3] is used to illustrate target measurement for a reversal pattern.
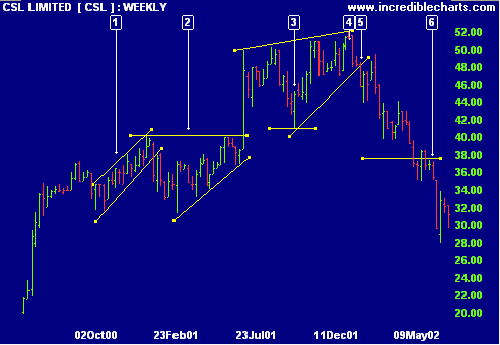
- Trend channel or rising wedge.
- Ascending triangle - bullish signal
- Rising wedge - bear signal. The targeted move for the reversal is measured from the lowest trough (41.06) to the highest peak.
- The highest peak is at 52.00. The targeted move is therefore 52.00 - 41.06 = 10.94
- The move is projected down from the breakout point at 48.40.
- The target is calculated by subtracting the move from the value
at the point of breakout:
Target = 48.40 - 10.94 = 37.46
Volume Confirmation
Volume normally expands at the start of the triangle or wedge, contracts as the pattern develops and then expands on the breakout.
Ascending triangles (and falling wedges) should exhibit higher volume on the up-swings. Descending triangles (and rising wedges) exhibit higher volume on the down-swings.
Trading Signals
Enter a trade at the breakout and place a stop-loss just outside the opposite side of the wedge or triangle pattern.
In the above CSL example, the stop is placed one tick above the upper trendline, at the highest peak on day [4].

Author: Colin Twiggs is a former investment banker with almost 40 years of experience in financial markets. He co-founded Incredible Charts and writes the popular Trading Diary and Patient Investor newsletters.
Using a top-down approach, Colin identifies key macro trends in the global economy before evaluating selected opportunities using a combination of fundamental and technical analysis.
Focusing on interest rates and financial market liquidity as primary drivers of the economic cycle, he warned of the 2008/2009 and 2020 bear markets well ahead of actual events.
He founded PVT Capital (AFSL No. 546090) in May 2023, which offers investment strategy and advice to wholesale clients.