How to Find the Strongest Trending Stocks on the ASX or Russell 3000
We have added a number of new stock screen filters which may leave readers confused as to what tools to use. So here is a quick review of some of our favorite filters for finding trending stocks.
- Directional Movement: DI Difference
- Relative Strength Index (RSI)
- Twiggs Momentum Oscillator (TMO)
- Exponential Moving Averages
Our focus is on long-term uptrends, that are expected to run for at least six months. We therefore use momentum filters (Twiggs Momentum, RSI & Directional Movement) with a time period of 13 weeks (half of the six month period).
Trend Attributes
In our discussion we will focus on uptrends and their attributes. Downtrends share many of the same characteristics, just in reverse
Uptrends normally possess the following attributes:
- An initial surge in momentum as the stock breaks through resistance and establishes an uptrend.
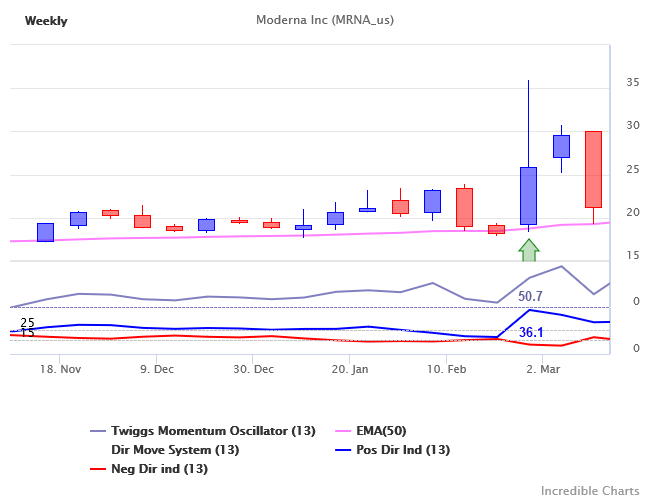
Figure 1: Moderna (MRNA) breaks out above recent highs at the start of the 2020 pandemic, TMO climbs to 50.7 and DI+ to 36.1 points above DI-. 
- Some stocks fail to hold above the new support level and the trend almost immediately collapses.
For more attributes of uptrends continue reading:
Trend Filters
We use trend filters for two reasons:
- To identify the surge in Momentum at the start of an uptrend; and
- To identify established trends that have demonstrated the ability to make steady gains.
The latter stages of the trend are normally best identified from the chart itself, rather than a stock screen filter.
Step 1: How to Identify the Surge in Momentum
Trading breakouts (above resistance) gets you into the trend early but is fraught with too many false breaks to be profitable most of the time.
Instead, we focus on a surge in momentum that frequently occurs after the breakout. Something has changed, news that has caused investors to abandon caution and chase the stock price higher. There are three stock screen filters that we can use to identify this:
- Directional Movement: DI Difference
- RSI Crossovers
- Twiggs Momentum
Momentum Screen Filters
Our focus is on long-term uptrends, that are expected to run for at least six months. We therefore use momentum filters with a time period of 13 weeks (half of the six month period).
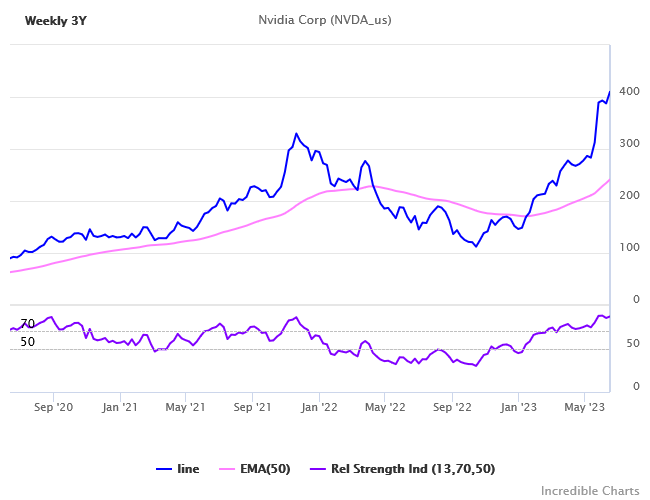
Figure 2: S&P 500 example screen returned a number of results. The most easily recognizable is Nvidia (NVDA), with RSI holding above 70 for more than 13 weeks.
For example screen filter settings, as well as results of our example screen when run on the S&P 500, Russell 3000, and ASX stocks, see:
Identifying Momentum Surges >>
Next Newsletter
We will follow with Step 2 in our next newsletter: identifying established trends.
Quote for the Week
Rule #33: Low stock prices are the ally of the rational buyer – high stock prices are the enemy of the rational buyer.
~ Doug Kass - 50 Laws of Investing
Reminder
Please note that stocks shown are for illustration purposes only and are not recommendations. Readers should conduct their own research.
Staff of Incredible Charts may directly or indirectly own shares in the above companies.
Colin Twiggs is director of The Patient Investor Pty Ltd, an Authorised Representative (no. 1256439) of MoneySherpa Pty Limited which holds Australian Financial Services Licence No. 451289.
Everything contained in this web site, related newsletters, training videos and training courses (collectively referred to as the "Material") has been written for the purpose of teaching analysis, trading and investment techniques. The Material neither purports to be, nor is it intended to be, advice to trade or to invest in any financial instrument, or class of financial instruments, or to use any particular methods of trading or investing.
Advice in the Material is provided for the general information of readers and viewers (collectively referred to as "Readers") and does not have regard to any particular person's investment objectives, financial situation or needs. Accordingly, no Reader should act on the basis of any information in the Material without properly considering its applicability to their financial circumstances. If not properly qualified to do this for themselves, Readers should seek professional advice.
Investing and trading involves risk of loss. Past results are not necessarily indicative of future results.
You, the Reader, need to conduct your own research and decide whether to invest or trade. The decision is yours alone. We expressly disavow all and any liability to any person, with respect of anything, and of the consequences of anything, done or omitted to be done by any such person in reliance upon the whole or any part of the Material.
Read the Financial Services Guide.
