Economic Outlook, March 2023
Below is an excerpt from Colin Twiggs' presentation to investors at Beech Capital on March 30, 2023, published with permission.
3. Underlying Causes of Instability
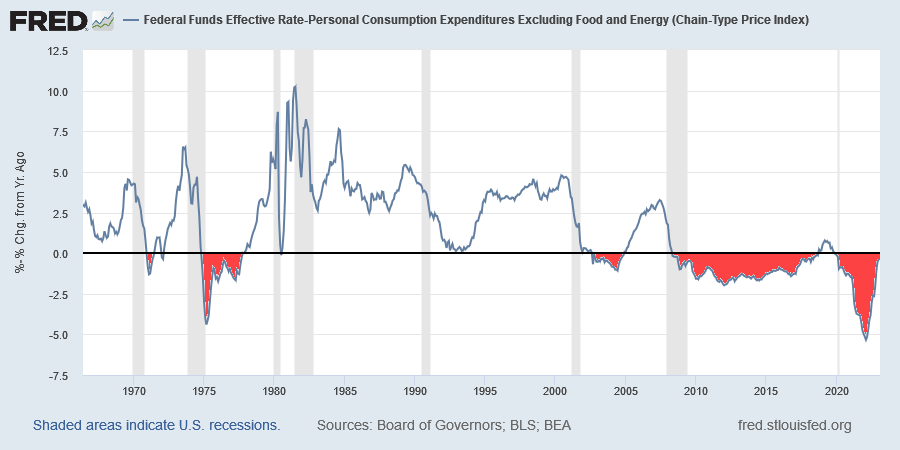
The root cause of financial instability is cheap debt. Whenever central banks suppress interest rates below the rate of inflation, the resulting negative real interest rates fuel financial instability.
The chart below plots the Fed funds rate adjusted for inflation (using the Fed's preferred measure of core PCE), with negative real interest rates highlighted in red.
Unproductive Investment
Negative real interest rates cause misallocation of capital into unproductive investments -- intended to profit from inflation rather than generate income streams. The best example of an unproductive investment is gold: it may rise in value due to inflation but generates no income. The same is true of art and other collectibles which generate no income and may in fact incur costs to insure or protect them.
Residential real estate is also widely used as a hedge against inflation. While it may generate some income in the form of net rents, the returns are normally negligible when compared to capital appreciation.
Productive investments, by contrast, normally generate both profits and wages which contribute to GDP. If an investor builds a new plant or buys capital equipment, GDP is enhanced not only by the profits made but also by the wages of everyone employed to operate the plant/equipment. Capital investment also has a multiplier effect. Supplies required to operate the plant, or transport required to distribute the output, are both likely to generate further investment and jobs in other parts of the supply chain.
Cheap debt allows unproductive investment to crowd out productive investment, causing GDP growth to slow. These periods of low growth and high inflation are commonly referred to as stagflation.
Debt-to-GDP
The chart below shows the impact of unproductive investment, with private sector debt growing at a faster rate than GDP (income), almost doubling since 1980. This should be a stable relationship (i.e. a horizontal line) with GDP growing as fast as, if not faster than, debt.
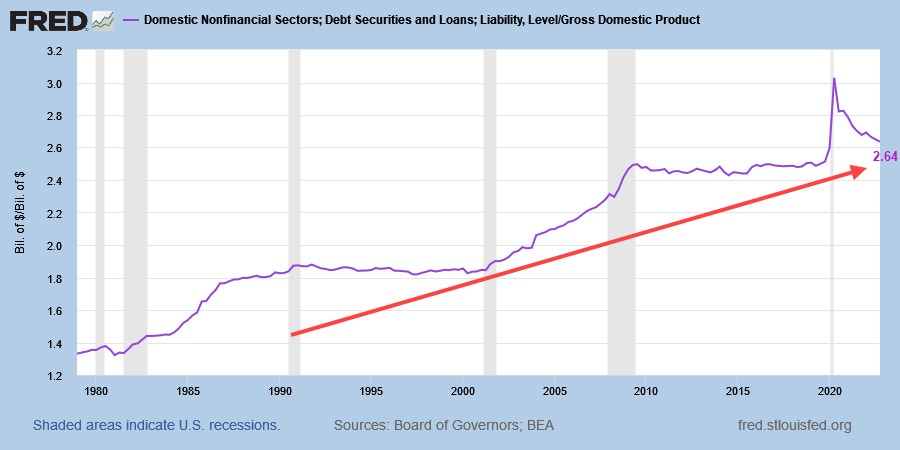
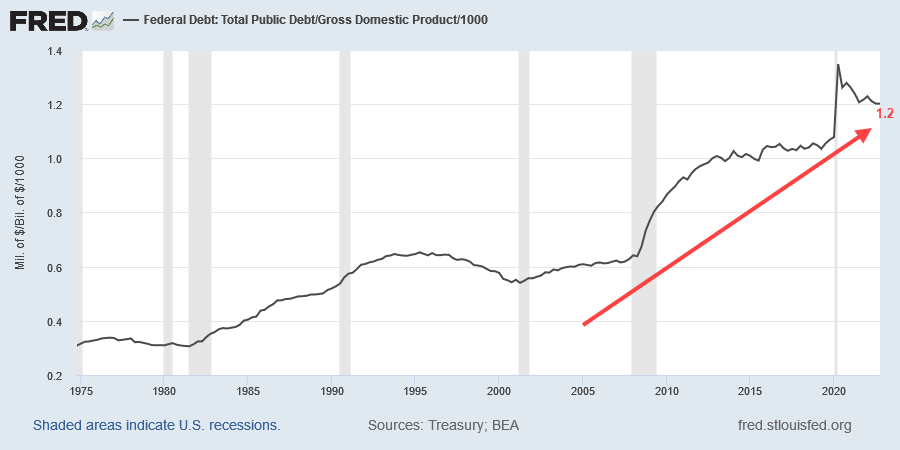
Even more concerning is federal debt. There are two flat sections in the above chart -- from 1990 to 2000 and from 2010 to 2020 -- when the relationship between private debt and income stabilized after a major recession. That is when government debt spiked upwards.
When the private sector stops borrowing, the government steps in -- borrowing and spending in their place -- to create a soft landing. Some call this stimulus but we consider it a disaster when unproductive spending drives up the ratio of government debt relative to GDP.
Research by Carmen Reinhart and Ken Rogoff (This Time is Different, 2008) suggests that states where sovereign debt exceeds 100% of GDP (1.0 on the above chart) almost inevitably default. A study by Cristina Checherita and Philip Rother at the ECB posited an even lower sustainable level, of 70% to 80%, above which highly-indebted economies would run into difficulties.
Rising Inflation
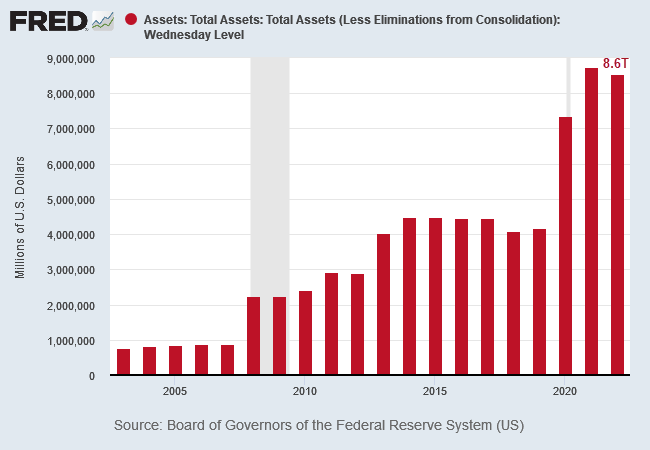
Inflationary pressures grow when government deficits are funded from sources outside the private sector. There is no increase in overall spending if the private sector defers spending in order to invest in government bonds. But the situation changes if government deficits are funded by the central bank or external sources.
The chart below shows how the Fed's balance sheet has expanded over the past two decades, reaching $8.6 trillion at the end of 2022, most of which is invested in Treasuries or mortgage-backed securities (MBS).
Quote for the Week
Rule #18: What we have learned from history is that we haven't learned from history.
~ Doug Kass - 50 Laws of Investing
Recent updates for Market Analysis Subscribers
Take advantage of our Market Analysis $1 special. New subscribers only.
Colin Twiggs is director of The Patient Investor Pty Ltd, an Authorised Representative (no. 1256439) of MoneySherpa Pty Limited which holds Australian Financial Services Licence No. 451289.
Everything contained in this web site, related newsletters, training videos and training courses (collectively referred to as the "Material") has been written for the purpose of teaching analysis, trading and investment techniques. The Material neither purports to be, nor is it intended to be, advice to trade or to invest in any financial instrument, or class of financial instruments, or to use any particular methods of trading or investing.
Advice in the Material is provided for the general information of readers and viewers (collectively referred to as "Readers") and does not have regard to any particular person's investment objectives, financial situation or needs. Accordingly, no Reader should act on the basis of any information in the Material without properly considering its applicability to their financial circumstances. If not properly qualified to do this for themselves, Readers should seek professional advice.
Investing and trading involves risk of loss. Past results are not necessarily indicative of future results.
You, the Reader, need to conduct your own research and decide whether to invest or trade. The decision is yours alone. We expressly disavow all and any liability to any person, with respect of anything, and of the consequences of anything, done or omitted to be done by any such person in reliance upon the whole or any part of the Material.
Read the Financial Services Guide.