Another stock market bubble?
First, please read the Disclaimer.
We see plenty of charts comparing major indices to GDP. Both the S&P 500 and Wilshire 5000 made new highs relative to GDP, warning that stock pricing is at a new extreme.
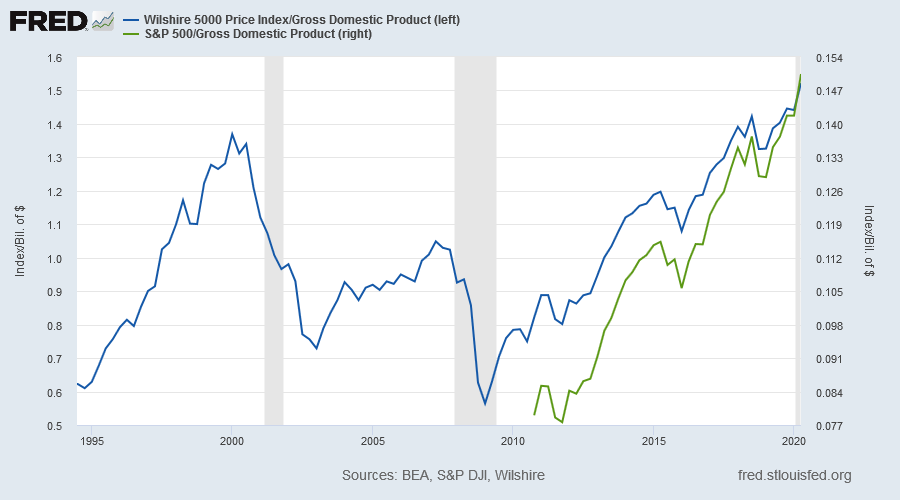
But comparing indices like these to an economy-wide measure like GDP is inaccurate for two key reasons:
- Index values are distorted by stock buybacks. Each time a company repurchases shares, the number of shares in the index decreases while the overall market cap remains the same, inflating the index value.
- Corporate profits are not a constant percentage of GDP but fluctuate with the economic cycle.
The chart below shows how corporate profits (before tax) reached a record high of 13.7% of GDP in early 2012 before declining to a low of 9.1% in Q2 this year.
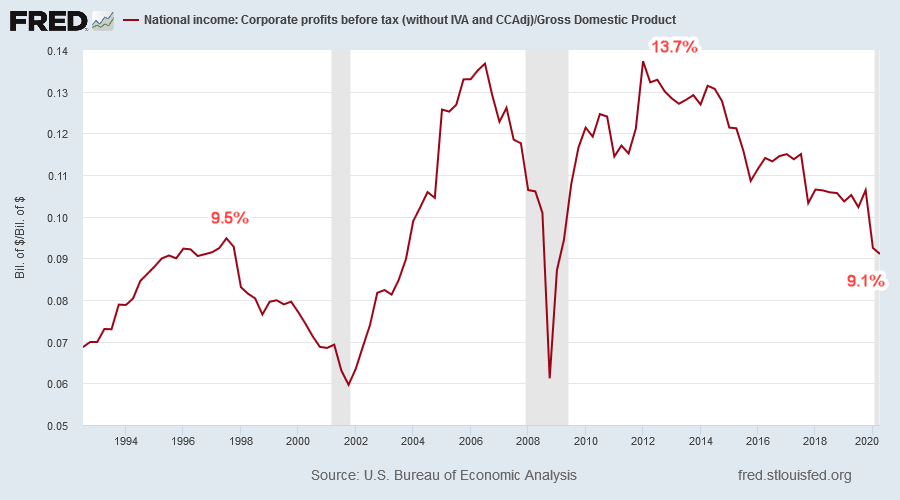
The current level of corporate profits to GDP (9.1%), while having fallen a long way from its 2012 peak, is still only slightly below the earlier peak of 9.5% from Q3 in 1997.
If we use market capitalization, rather than the index value, we eliminate distortion from stock buybacks. If we use corporate profits instead of GDP, we get closer to a true measure of stocks versus earnings. The chart below compares S&P 500 market cap to overall US corporate profits before tax.
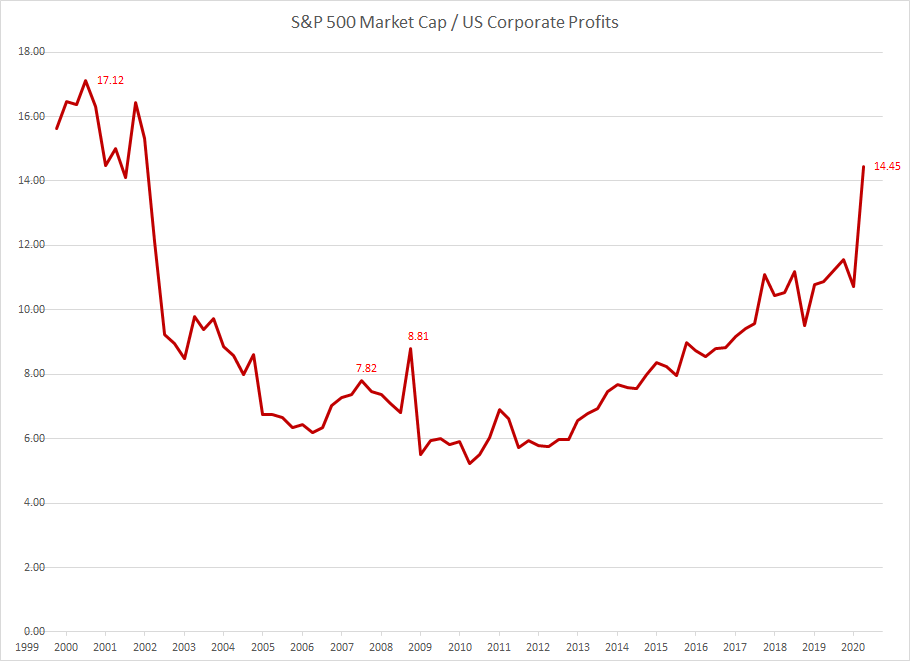
The ratio at June 30 is at a precarious level of 14.45, compared to the Dotcom peak of 17.12 in Q3 of 2000 and the pre-GFC peak of 7.82 in Q3 2007 (the Q4 2008 peak of 8.81 is caused by the record fall in corporate profits during the GFC).
Conclusion
Comparing market cap to corporate profits is a useful indicator of stock market valuation. Go overweight stocks when the ratio is low (below 8.0) and underweight when it is high (above 10.0). The present extreme reading of 14.45 warns of another stock market bubble similar to the Dotcom era.
Of course, if a man is both wise and lucky, he will not make the same mistake twice. But he will make any one of ten thousand brothers or cousins of the original. The Mistake family is so large that there is always one of them around when you want to see what you can do in the fool-play line.
~ Jesse Livermore
Updates for Market Analysis Subscribers
Please take advantage of our $1 special offer for the first month. Cancel at any time.
Disclaimer
Colin Twiggs is director of The Patient Investor Pty Ltd, an Authorised Representative (no. 1256439) of MoneySherpa Pty Limited which holds Australian Financial Services Licence No. 451289.
Everything contained in this web site, related newsletters, training videos and training courses (collectively referred to as the "Material") has been written for the purpose of teaching analysis, trading and investment techniques. The Material neither purports to be, nor is it intended to be, advice to trade or to invest in any financial instrument, or class of financial instruments, or to use any particular methods of trading or investing.
Advice in the Material is provided for the general information of readers and viewers (collectively referred to as "Readers") and does not have regard to any particular person's investment objectives, financial situation or needs. Accordingly, no Reader should act on the basis of any information in the Material without properly considering its applicability to their financial circumstances. If not properly qualified to do this for themselves, Readers should seek professional advice.
Investing and trading involves risk of loss. Past results are not necessarily indicative of future results.
The decision to invest or trade is for the Reader alone. We expressly disclaim all and any liability to any person, with respect of anything, and of the consequences of anything, done or omitted to be done by any such person in reliance upon the whole or any part of the Material.
Please read the Financial Services Guide.