S&P 500 target
By Colin Twiggs
August 31, 2019 1:30 a.m. EDT (3:30 p.m. AEST)
First, please read the Disclaimer.
Important News
Dear Friends,
I have been writing the Trading Diary newsletter for almost 20 years. It has been a great success but times are changing. Advertisers have largely migrated to Google & social media and independent advertising through brokers has slowed to a trickle. We have therefore decided to change the format of the newsletter in line with these developments.
In future, market analysis will be provided by way of subscription through The Patient Investor. The format will remain the same, with regular updates focused on major markets — stocks, precious metals, commodities, interest rates and the economy — and increased coverage of sectors and industries.
While the change may seem sudden, the changes in advertising revenue have been evident for more than a year and I have been postponing the inevitable for some time.
Details of subscriptions are available at The Patient Investor and include a $1 subscription for the first month.
Thank you for your support.
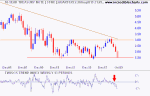
S&P 500 Target
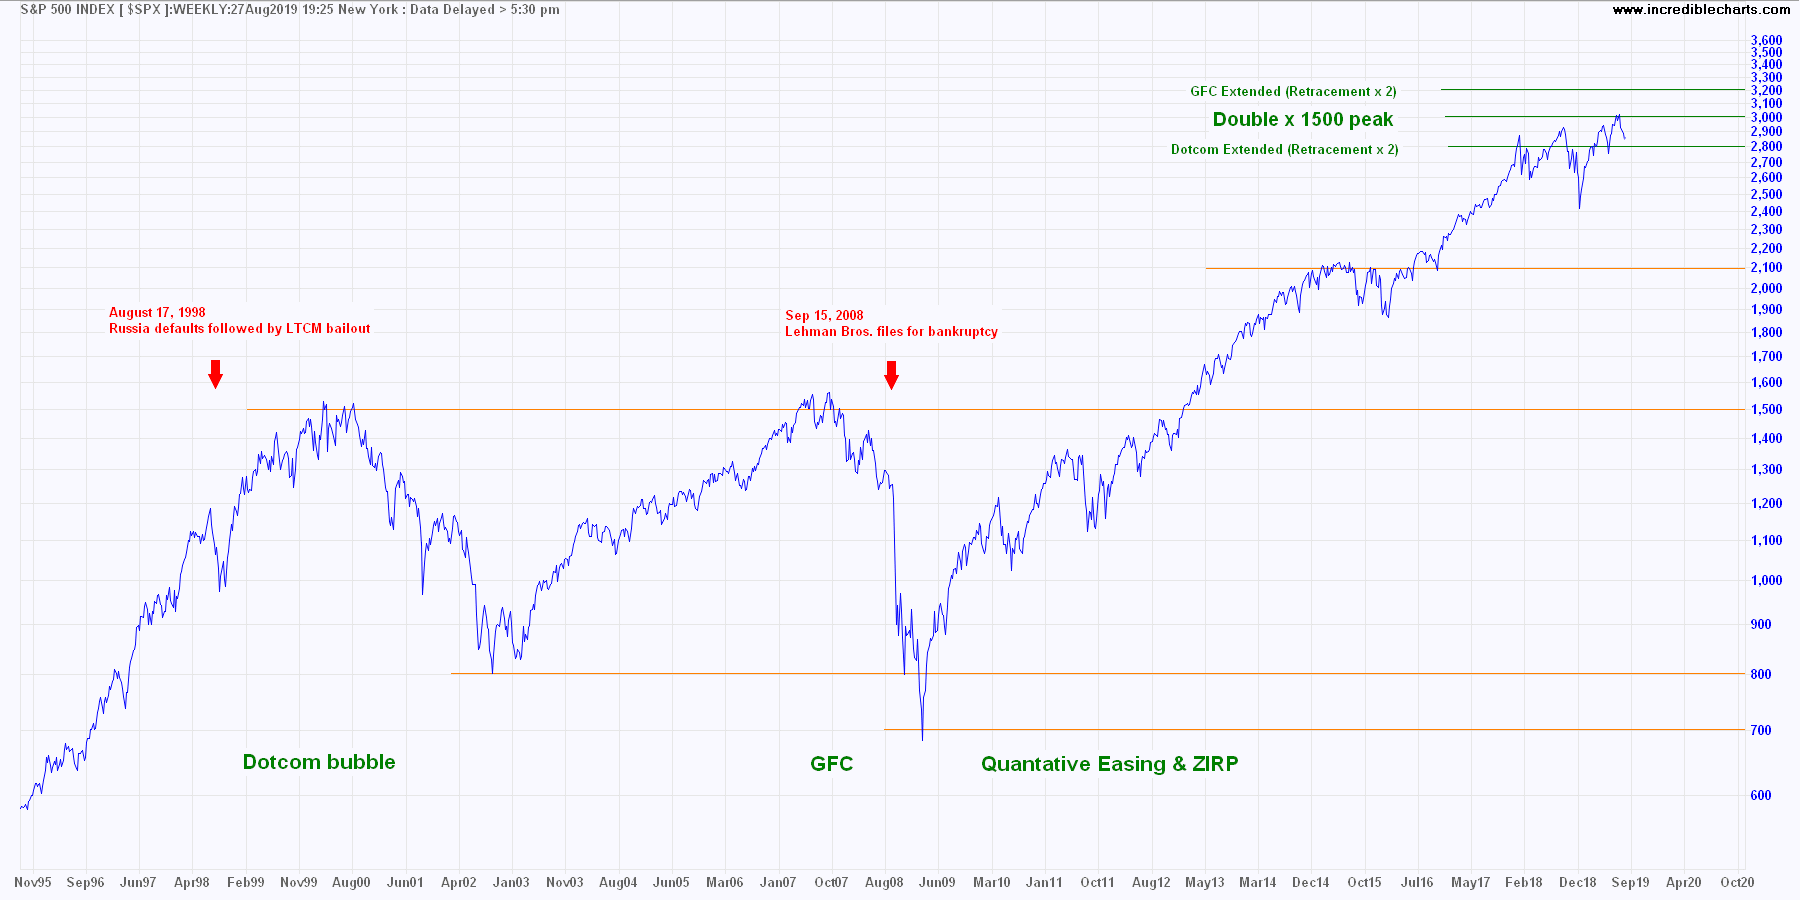
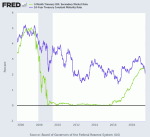
My target for the current S&P 500 long-term advance has been 3000 for a number of years. The chart below explains the target calculation.
 Click here to view a full screen image.
The Dotcom bubble retraced from a peak of 1500 to a low of 800. Readers who are familiar with my method will know that on a short- or medium-term chart I would simply extend the retracement above the previous peak of 1500 (giving a target of 2300) but long-term charts work better on a log scale.
If we extend the distance between peak and trough above the Dotcom peak on a log scale chart, we get a target of 2800.
If we do the same for the global financial crisis (GFC), we get a target of 3200.
Mid-way between the two is another important target, of 3000, which is double the previous two peaks at 1500.
Of the three targets, I feel that 3000 is the strongest. Not only because it is the middle target and double the previous peaks, but round numbers are important psychological barriers. The Dow, for example, took more than 10 years to break resistance at 1000.
Now some may feel that technical analysis like this has as much significance as reading tea leaves or consulting your astrological charts. But observation shows that market activity tends to cluster around significant levels (e.g. 1500) or numbers and can present formidable barriers to trend progress.
Primary Support
The next question is: if the market reverses at 3000, how far is it likely to retrace? There is no straight answer, but primary reversals normally retrace between 50% and 100% of the previous gain, or between 25% and 50% of the current level.
There are two major support levels evident on the chart:
- The 2100 peak from 2015, a 50% retracement (on a log scale) of the preceding advance; and
- The 1500 peak from 2000 and from 2007, marking 100% retracement of the previous advance and also a 50% retracement from the current level.
A lot would depend on the severity of the reaction.
"You watch the market — that is, the course of prices as recorded by the tape with one object: to determine the direction. Prices, we know, will move either up or down according to the resistance they encounter. For purposes of easy explanation we will say that prices, like everything else, move along the line of least resistance. They will do whatever comes easiest, therefore they will go up if there is less resistance to an advance than to a decline; and vice versa."
~ Jesse Livermore
Latest
-
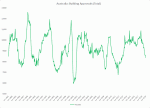
ASX
Building approvals and construction warn of a slow-down. -
ASX
Rate cuts are not helping. -
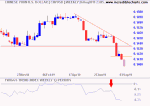
Gold
Gold consolidates as the Yuan plunge continues. -
 S&P 500
Donald Trump and the next recession. -
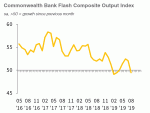
 Global economy
Approaching stall speed. -
 The long game
Why the West is losing. -
S&P 500
Buybacks are hurting growth. -
S&P 500
Rate cuts and buybacks — the emperor's new clothes. -
S&P 500
A good time to be cautious. -
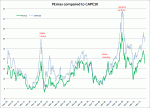
PEmax
Why you should be wary of Robert Shiller's CAPE -
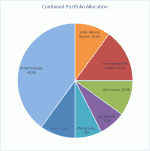
Portfolio
Investing in a volatile market - April 2018
Disclaimer
Colin Twiggs is director of The Patient Investor Pty Ltd, an Authorised Representative (no. 1256439) of MoneySherpa Pty Limited which holds Australian Financial Services Licence No. 451289.
Everything contained in this web site, related newsletters, training videos and training courses (collectively referred to as the "Material") has been written for the purpose of teaching analysis, trading and investment techniques. The Material neither purports to be, nor is it intended to be, advice to trade or to invest in any financial instrument, or class of financial instruments, or to use any particular methods of trading or investing.
Advice in the Material is provided for the general information of readers and viewers (collectively referred to as "Readers") and does not have regard to any particular person's investment objectives, financial situation or needs. Accordingly, no Reader should act on the basis of any information in the Material without properly considering its applicability to their financial circumstances. If not properly qualified to do this for themselves, Readers should seek professional advice.
Investing and trading involves risk of loss. Past results are not necessarily indicative of future results.
The decision to invest or trade is for the Reader alone. We expressly disclaim all and any liability to any person, with respect of anything, and of the consequences of anything, done or omitted to be done by any such person in reliance upon the whole or any part of the Material.
Please read the Financial Services Guide.