Hardly an over-heated market
By Colin Twiggs
September 9, 2017 1:00 a.m. EDT (3:00 p.m. AEST)
Please note changes to the Disclaimer
Colin Twiggs is a director of The Patient Investor Pty Ltd, an Authorised Representative (no. 1256439) of MoneySherpa Pty Limited which holds Australian Financial Services Licence No. 451289.
Everything contained in this web site, related newsletters, training videos and training courses (collectively referred to as the "Material") has been written for the purpose of teaching analysis, trading and investment techniques. The Material neither purports to be, nor is it intended to be, advice to trade or to invest in any financial instrument, or class of financial instruments, or to use any particular methods of trading or investing.
Advice in the Material is provided for the general information of readers and viewers (collectively referred to as "Readers") and does not have regard to any particular person's investment objectives, financial situation or needs. Accordingly, no Reader should act on the basis of any information in the Material without properly considering its applicability to their financial circumstances. If not properly qualified to do this for themselves, Readers should seek professional advice.
Investing and trading involves risk of loss. Past results are not necessarily indicative of future results.
The decision to invest or trade is for the Reader alone. We expressly disclaim all and any liability to any person, with respect of anything, and of the consequences of anything, done or omitted to be done by any such person in reliance upon the whole or any part of the Material.
Discussions as to whether the stock market is over-priced normally imply that stocks are about to fall if valuations are too high. But history shows that this isn't true. The euphoria of bull markets often outruns earnings multiples and only reverses when there is an unexpected fall in earnings.
Earnings multiples (the price-earnings ratio) may rise for two reasons:
- Stock prices are rising faster than earnings; or
- Earnings are falling and stock prices are declining at a slower rate.

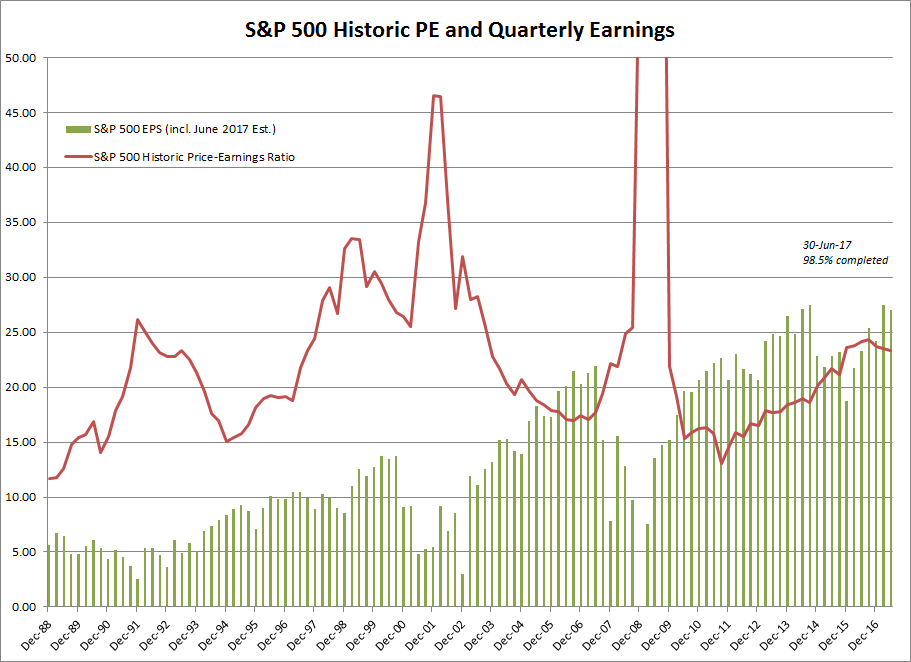
The S&P 500 historic price-earnings ratio (based on the last 4 quarters earnings) spiked above 20 several times in the last three decades:
- 1991 was caused by falling earnings;
- 1997 by rising stock prices;
- sharp falls in earnings were responsible for 2001 and 2008; and
- declining earnings, particularly in the Energy sector, explain the bump in 2015.
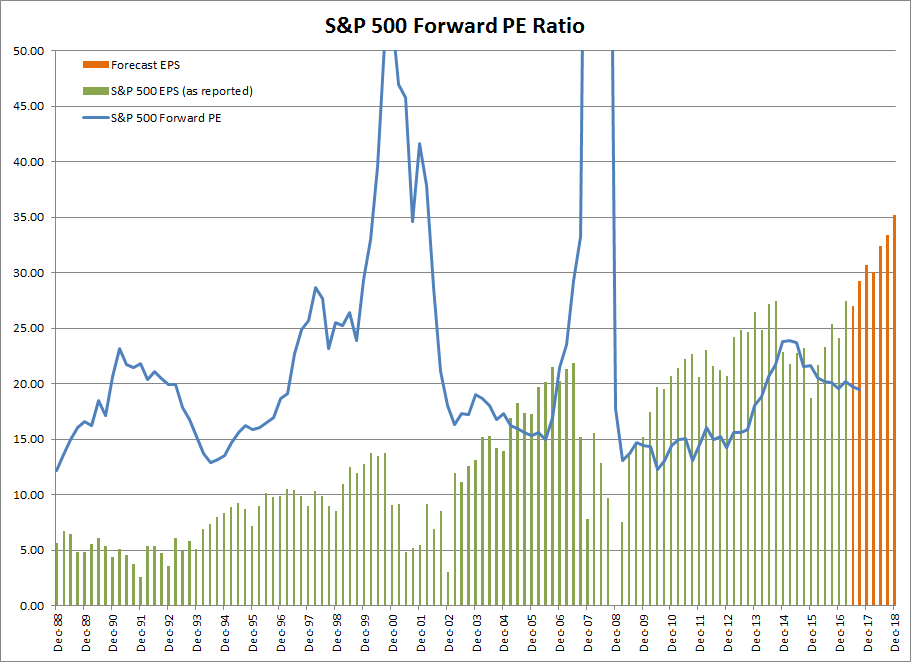
The problem with historic PE is that it looks backward, at the last 4 quarters, rather than forward. If we take the Forward PE, based on the next 4 quarters earnings estimates, we can see that earnings are recovering.

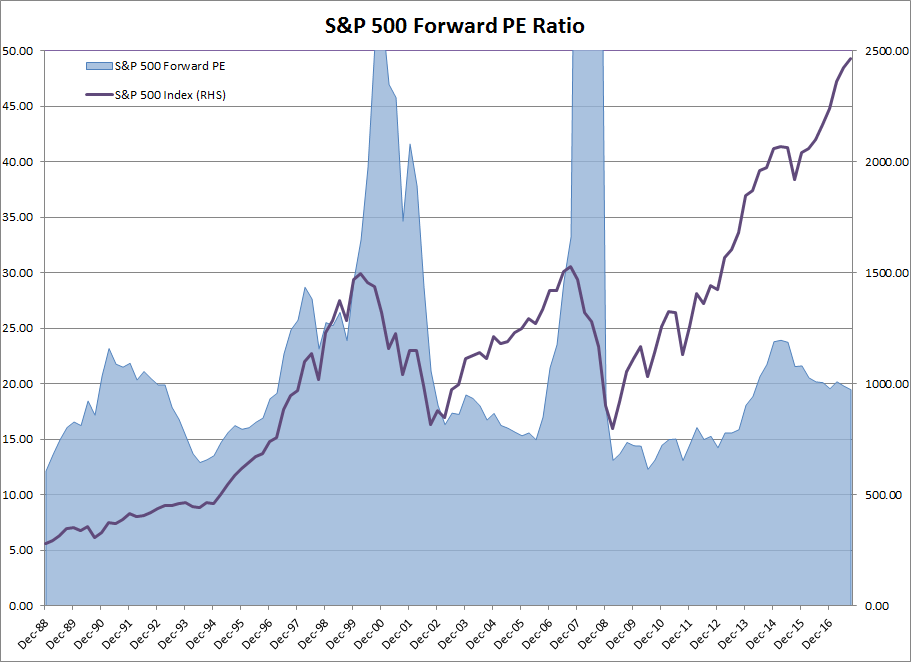
Forward PE dipped below 20 in 2016, indicating that expected earnings are advancing faster than prices.
This does not signal a buy opportunity, which normally presents when Forward PE is close to 15:
- 1988-1989
- 1993-1994
- 2002-2005
- 2009-2012

Nor does it represent a sell signal.
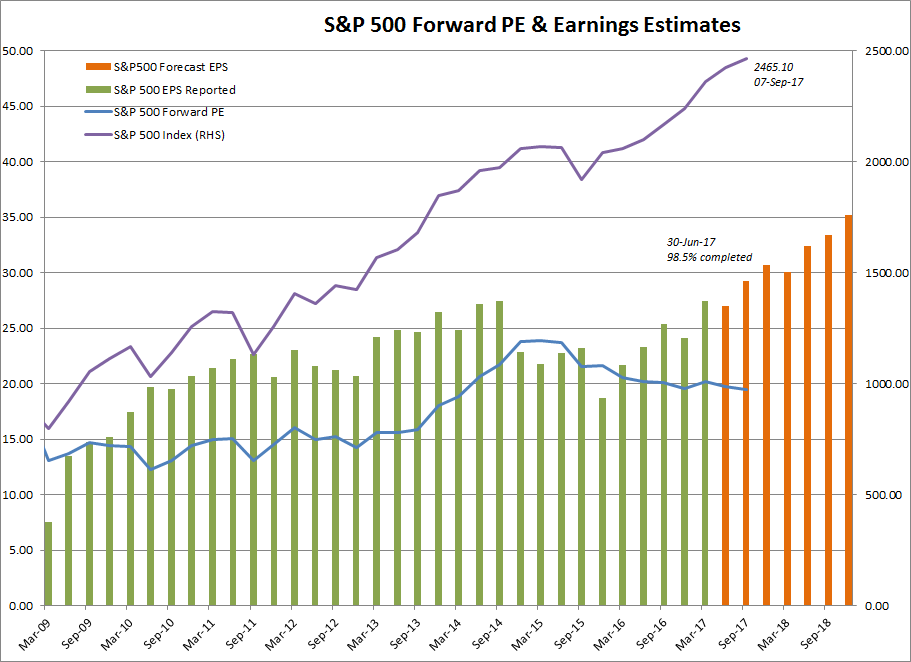
Most corporations (98.5%) have reported earnings for June 2017. Estimates are included for the remainder, giving total earnings of $27.00 per share.
S&P project that earnings will grow a further 20% over the next four quarters (Jun-18: $32.40). This may be optimistic but provided earnings grow faster than the index we will see earnings multiples decline.

Hardly an over-heated market.
If we become increasingly humble about how little we know, we may be more eager to search.
~ Sir John Templeton
