Sell in May and run away?
By Colin Twiggs
May 18, 2017 12:00 a.m. EDT (2:00 p.m. AEST)
Disclaimer
Please read the Disclaimer. I am not a licensed investment adviser.
What's New: How to Screen for Trends with Twiggs Money Flow & Twiggs Momentum
Apologies for the confusion in Tuesday's newsletter. I posted the same image (stock screen #90616) twice. Hopefully readers found the correct stock screen #90740 on the Shared tab.
I have posted the correct images on the website.
Market Risk
Markets fell sharply today. But before we look at the charts, let's examine three fundamental measures of market stress.
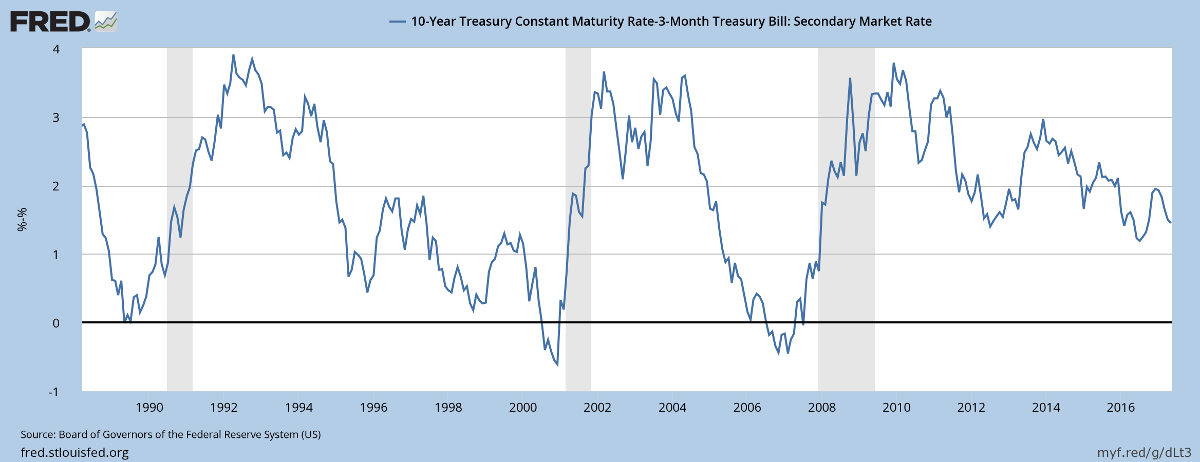
A yield differential near zero indicates bank margins are being squeezed. Lending normally slows, leading to a recession. But the current yield differential of 1.45%, calculated by subtracting the yield on 3-month T-bills from the yield on 10-year Treasuries, is reasonably healthy.
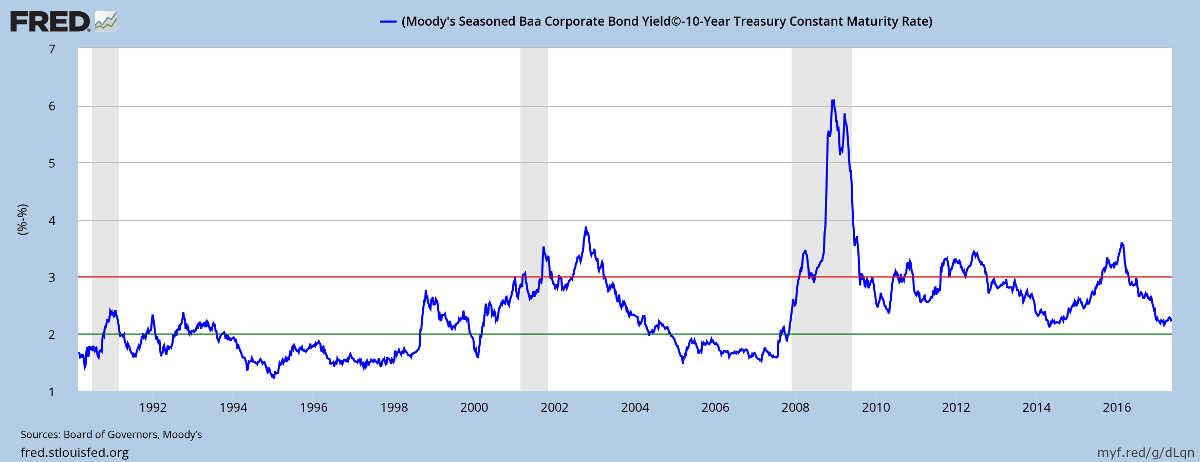
The yield spread between the lowest investment grade corporate bonds (Baa) and 10-year Treasuries is a useful measure of market risk. The risk premium widens in times of uncertainty. Since 2016 the Baa spread has fallen by more than one percent, to 2.25%, indicating low market risk.
The above indications are supported by the St Louis Fed Financial Stress Index which is at a record low of -1.451 since its commencement in 1994.
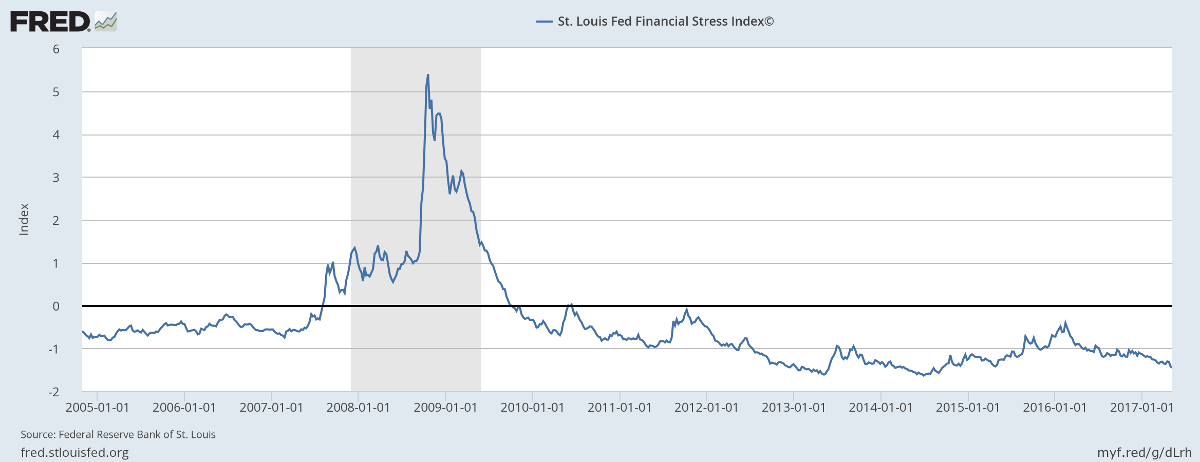
The St Louis Fed Financial Stress Index measures the degree of financial stress in the markets and is constructed from 18 weekly data series: seven interest rate series, six yield spreads and five other indicators. Each of these variables captures some aspect of financial stress. Accordingly, as the level of financial stress in the economy changes, the data series are likely to move together.
The average value of the index, which begins in late 1993, is designed to be zero. Thus, zero is viewed as representing normal financial market conditions. Values below zero suggest below-average financial market stress, while values above zero suggest above-average financial market stress.
Real GDP growth dipped to 1.9% for the first quarter 2017, compared to 2.0% for Q4 2016. While growth is modest, hours worked by nonfarm employees improved to 1.55% in April 2017 from a low of 1.03% in February, suggesting that growth is likely to continue.
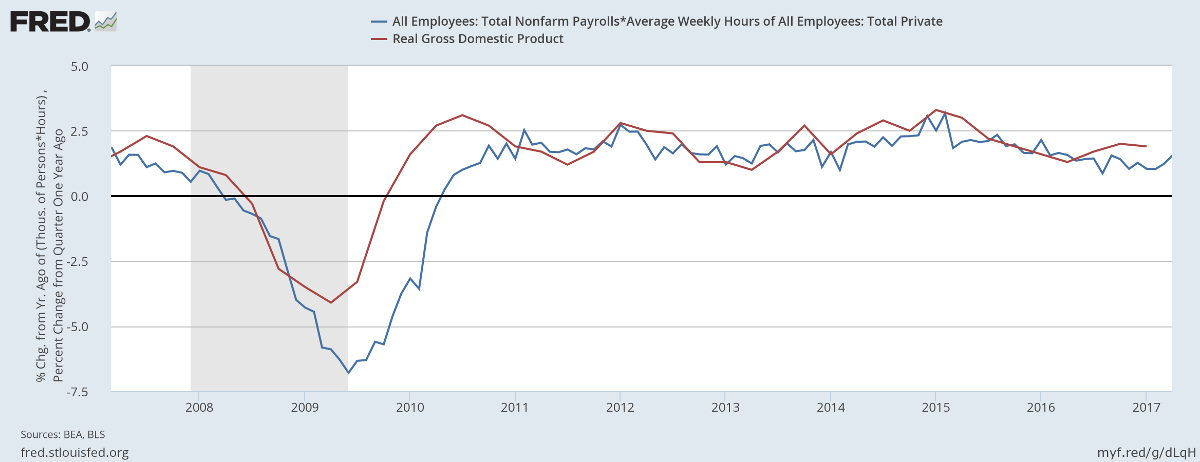
There is little sign of stress in financial markets other than the latest Trump turmoil.
Trump Turmoil
Discussion of a possible impeachment action against President Donald Trump is rife in the media and seems to have spooked financial markets.
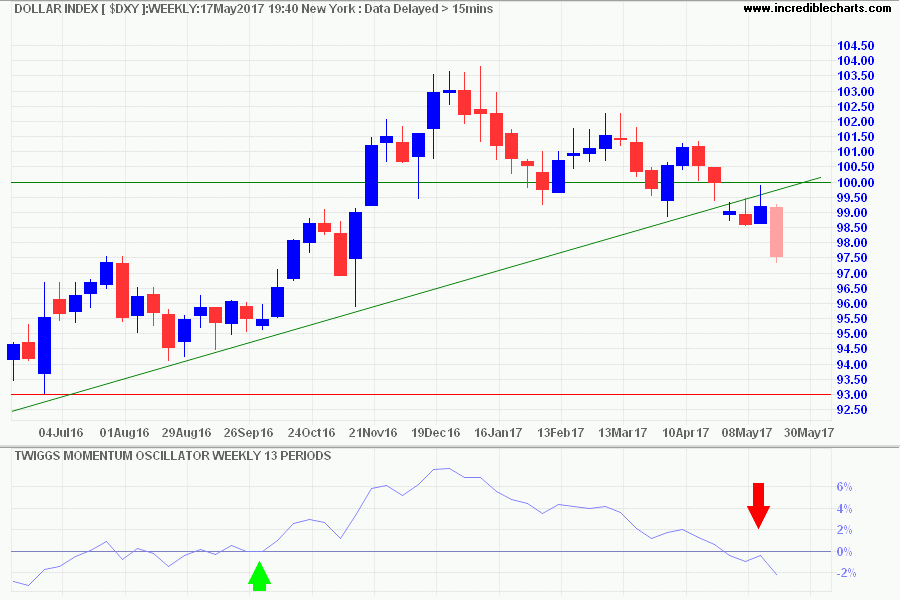
The Dollar Index fell through support at 98.50, signaling another decline. The long-term target is 93.00.
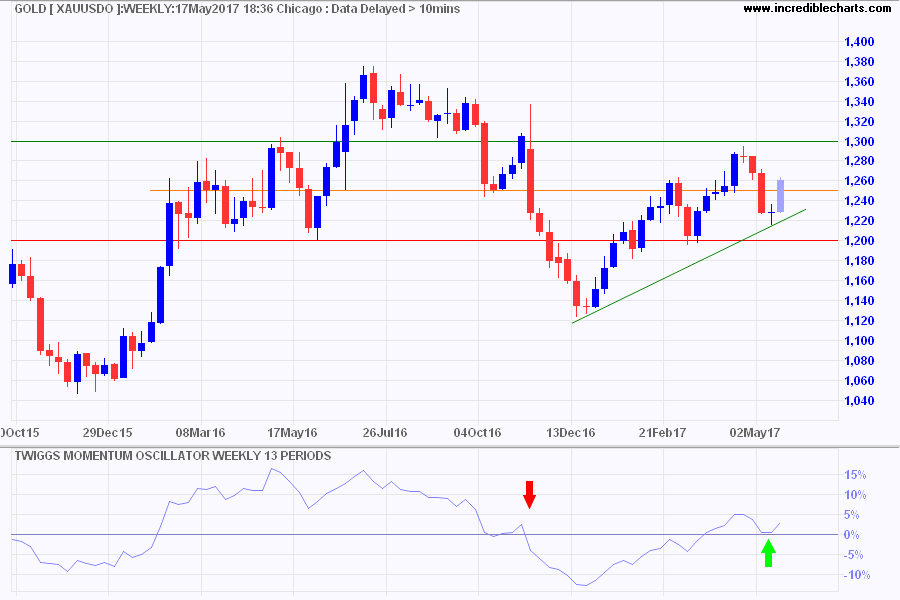
Gold rallied, breaking through resistance at $1250/ounce. Follow-through above $1300 would signal another advance, with a target of the 2016 high at $1375.
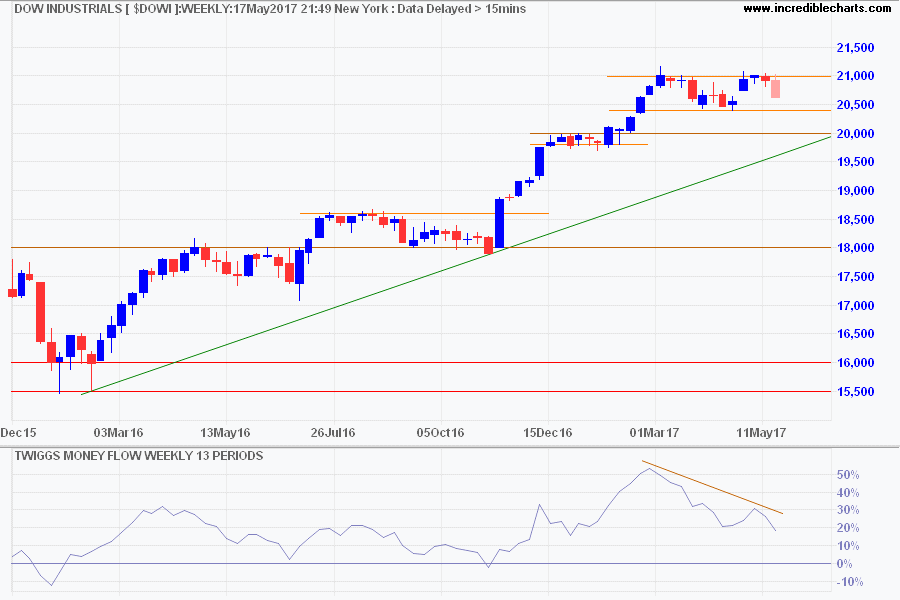
Dow Jones Industrial Average retreated from resistance at 21000. Expect a test of medium-term support at 20400. Reversal below 20000 would be cause for concern.
The S&P 500 is headed for a test of medium-term support at 2320. Breach would likewise signal a strong correction.
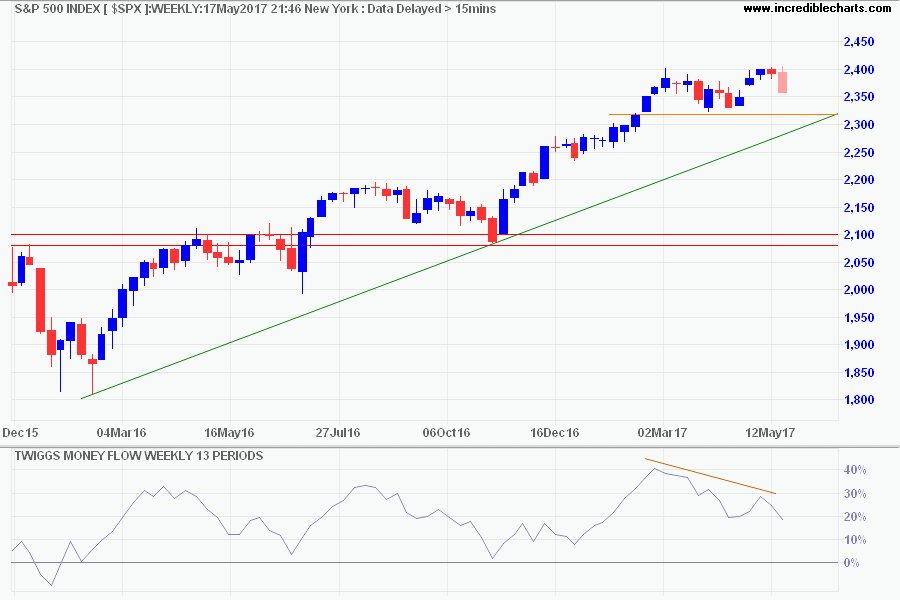
We are likely to get a secondary correction but I expect the bull market to continue. Impeachment of Trump would be a temporary setback and would make me more bullish on the long-term outlook.
It's probably better to have him inside the tent pissing out,
than outside the tent pissing in.~ President Lyndon Johnson on FBI Director J. Edgar Hoover
