Volume Indicator
Volume is used to highlight unusual trading activity in a security. It can be displayed as a separate indicator in Daily, Weekly or Monthly format.
Volume signals are covered in detail under Volume Patterns.
Example
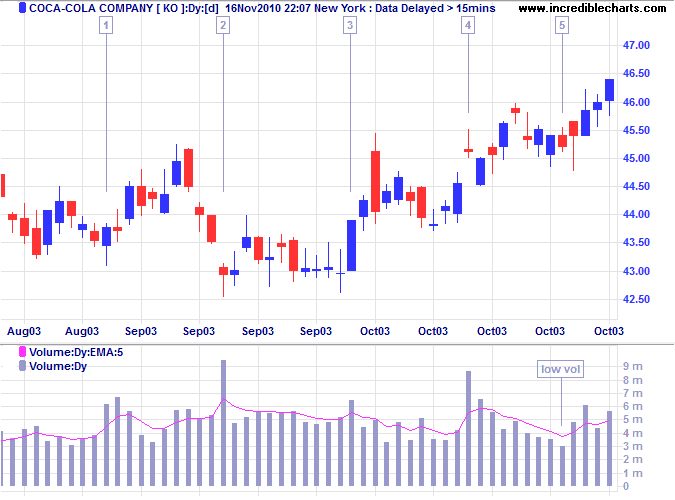
Coca Cola Corporation shows a close-up of a ranging market with daily volume and a 5-day exponential moving average.
Mouse-over chart captions to display trading signals.
Significant increases in volume can be seen on days [1] to [4]. The first three occur on days when price closes near the daily high, indicating accumulation (buying pressure). On day [4] price closes near the daily low, warning of distribution (selling pressure). Low volume on day [5] indicates uncertainty, but is followed by rising volume and strong closes, signaling accumulation.
Setup
See Indicator Panel for directions on how to set up an indicator. To alter the default settings - Edit Indicator Settings.
To create a Volume Moving Average:
- Open the
 Indicator Panel
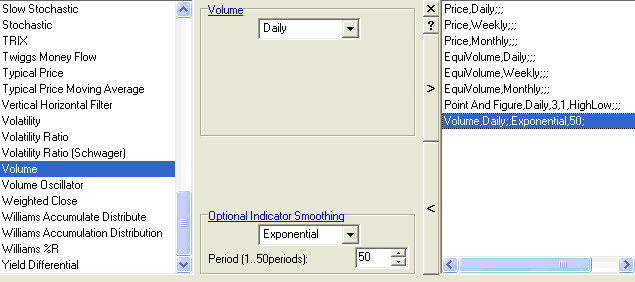
- Select Volume in the left column
- Under Optional Indicator Smoothing, set a
moving average
(the above example has been set to a 5-Day exponential moving average of Volume) - Save [>] the indicator settings and
- Close [x] the Indicator Panel.
Volume Colors
Selecting Volume With Close Colors in the Indicator menu, allows you to color volume bars according to whether price closes up or down on a given day.
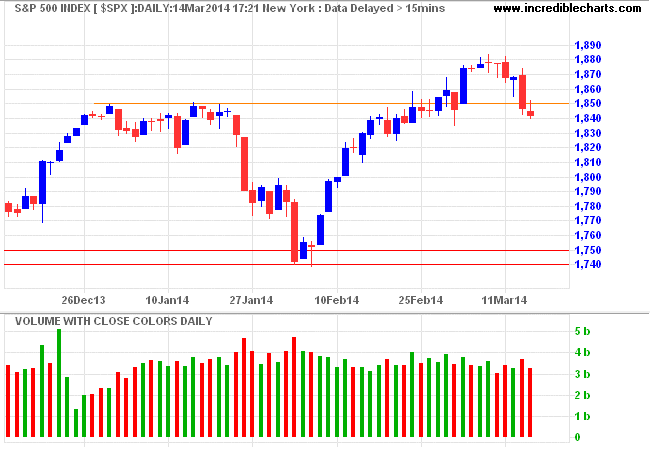
Standard colors are green (Up days) and red (Down days) but can be varied by selecting Format Charts >> Colors >> Indicator Up (+) and Indicator Down (-) on the chart menu.
Volume Twiggs® Standard Deviation
I prefer to have less clutter on the chart and only highlight days with abnormal volume. Select Volume Twiggs Standard Deviation in the Indicator menu to highlight volume bars that are one or two standard deviations above or below average volume. High volume normally denotes opposition to the current trend and low volume often denotes lack of support for the trend. Volume is especially useful when read in conjunction with the daily candlestick pattern and support/resistance levels.
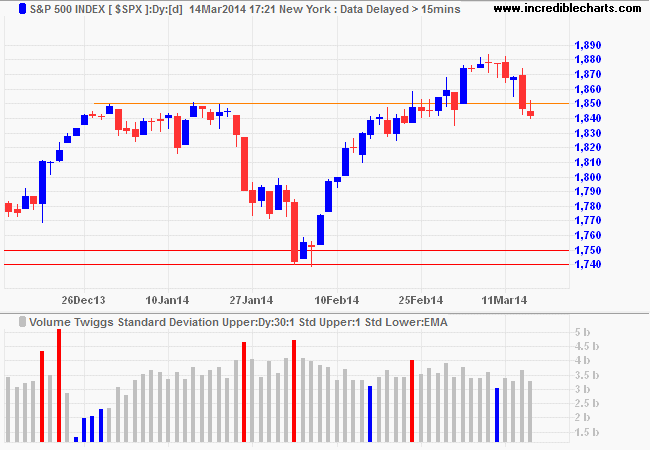
Default settings are one standard deviation and a moving average of 30 days. Standard colors are red (High volume) and green (Low volume) but can be varied by selecting Format Charts >> Colors >> Indicator Up (+) and Indicator Down (-) on the chart menu.

Author: Colin Twiggs is a former investment banker with almost 40 years of experience in financial markets. He co-founded Incredible Charts and writes the popular Trading Diary and Patient Investor newsletters.
Using a top-down approach, Colin identifies key macro trends in the global economy before evaluating selected opportunities using a combination of fundamental and technical analysis.
Focusing on interest rates and financial market liquidity as primary drivers of the economic cycle, he warned of the 2008/2009 and 2020 bear markets well ahead of actual events.
He founded PVT Capital (AFSL No. 546090) in May 2023, which offers investment strategy and advice to wholesale clients.