Pitfalls of Trend Trading
If you are going to trade trends, no matter what the time frame, you are likely to encounter three major problems: false starts, early shakeouts and late exits.
False Starts
Also known as whipsaws, false starts occur when your setup gives a positive signal, immediately followed by a reversal. You are no sooner stopped out of your position when the setup gives another buy signal. This is frustrating; and expensive. Many traders lose heart and fail to take the second entry, only to find that the trend spikes sharply upward, leaving them ready to throw their PC (or themselves) through the window.
Shake-Outs
If you move your stops up to below the low of each subsequent correction, there are going to be times when you are shaken out; no matter how strong the trend. It is just in the nature of the beast. Even if you are more cautious in ratcheting up your stops, applying some kind of filter, there are still going to be times when you are stopped out. And they are going to be expensive -- because of the filter. Shakeouts are covered in more detail elsewhere in the Trading Guide.
Another trick is to turn and turn and turn, until again your body senses the rhythm, then, just as suddenly, it will reverse direction. Or the bull will fake to go one way and then take off in the opposite direction.
Example
Here is a classic fast-trending stock from the ASX 200. Arc Energy has increased by more than 1000% in the last 4 years. The stock completed a broad double bottom in 2001, with a breakout at [C], and has never looked back. I have used point and figure charts because they are less subjective than the normal closing price or weekly candlestick charts.
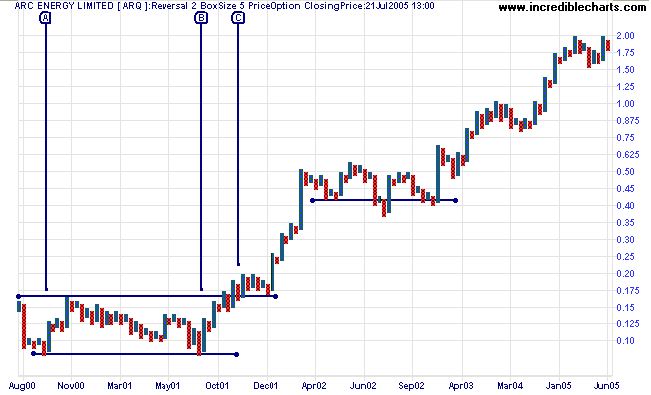
Can you see how difficult it is to stay with the trend? Either insiders or professionals had recognized the stock's value and tried every trick in the book to shake out existing positions and claim a bigger stake for themselves. In all there are 16 potential false breaks or shake-outs.
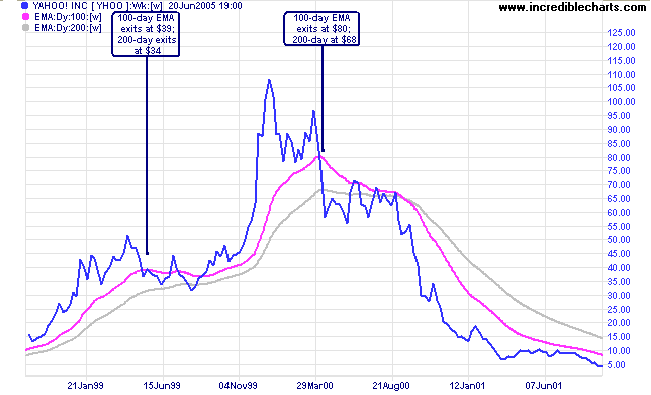
Late Exits
Late exits were covered under Selecting A Long-Term Moving Average but a quick recap may help.
Trend-following systems either suffer from a large number of shake-outs or are slow to exit when the trend reverses; and often both. You can't have your cake and eat it. We will deal more with exit strategies in a later article.
Taking Profits Too Early
Apart from systemic problems we also need to consider the human
aspect. A trend trading system builds psychological pressure as the
trader witnesses repeated gains followed by significant retracements
and frequent late exits at trend reversals. Pressure can build to
such an extent that the trader overrides his system, attempting to
take profits at a perceived high point in the trend. At this point
he/she is following their emotions rather than a system -- a recipe for disaster.
Managing psychological pressure will be dealt with in a later article.
Back Fitting Systems
It makes sense to back-test your system on historical data, to ensure that it works, but don't waste time fine-tuning your settings to fit the data. You may design the perfect system to maximize profits on historical data but it will not work as well when you trade live: the future is never an exact replica of the past.
Design Considerations
Type of Stocks and Trends
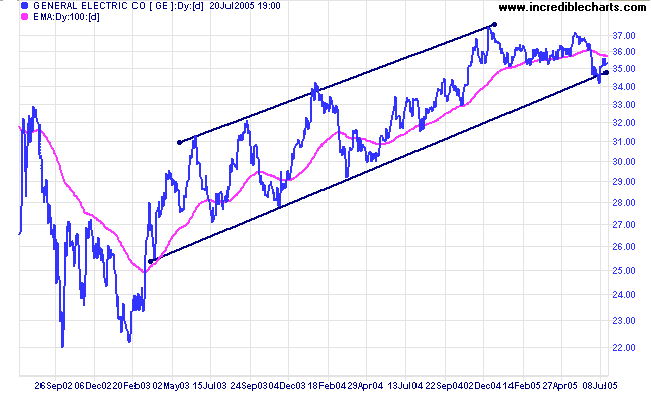
Blue chip stocks are more reliable but don't expect to find many fast-moving trends. They tend to fall into the slow but steady category; though occasionally they may still spring a surprise.
Fast-moving, highly volatile stocks are more exciting, but also more difficult, to trade. Expect larger numbers of false starts, shakeouts and trend reversals.
Retracements
What type of retracements are you likely to tolerate? This is difficult to answer in abstract, because of the lack of emotional pressure, but give it a try. Imagine that you have a million dollars riding on a single stock** that you have held for several months. How much of a retracement would you comfortably tolerate?
- 10 per cent?
- 20 per cent?
- 30 per cent?
I believe that not many traders could honestly answer more than 20%; and many would be more comfortable with 10%. If that is your comfort zone, do not try to trade a system that tolerates higher retracements.
** Not that I would ever advise you to invest a million dollars in a single stock. It is just that a large sum of money brings home the significance of the percentage losses.
Time Frame
What time frame do you plan to trade? Obviously the tolerated level of retracement will vary depending on the time frame. Also, a stock may be trending at different speeds (and directions) in separate time frames. Swing traders may be very happy with a stock that oscillates rapidly in a broad trend channel, while long-term traders may find that the swings overlap, resulting in a slow-moving primary trend.
Transaction Costs and Slippage
What are your transaction costs per trade? Easy to calculate if your broker
works on a straight percentage; a bit more difficult if you are charged a flat
fee; even more difficult if you are charged a fixed fee per share.
Slippage is often underestimated. Your stops will often be filled at below the
trigger price (or above when selling short) and entries often occur at obvious
trigger points -- when everyone is trying to get in at the same price.
You need a rough and ready estimate of what your total transaction cost is
likely to be for any given trade; even if it is just an average like 0.5%
for each leg of the trade.
Consolidations
Do you want your money tied up in a stock that moves sideways for 6 months to a year? It may look great on a 10 year chart to be able to stay with a trend from start to finish, riding out the mid-point consolidation without being unseated. Bear in mind that you may end up with a negative return for a year or more, when you could have been making money elsewhere in the market. It is hard to maintain your enthusiasm for a system after several months of watching your stock becalmed. And mid-point consolidations look remarkably like tops, until they complete an upward breakout.
Realistic Expectations
Newcomers often expect to catch trends from start to finish. It is not that easy.
~ Edwin Lefevre: Reminiscences of a Stock Operator (1923)
If you try to catch the absolute start of a trend, the number of false starts is likely to be so high that it will wreck the viability of your whole system. Similarly, if you try to catch the absolute peak, in most cases you are either going to exit too early or too late; again destroying the viability of the system. Most good systems are content to leave the early and late (and most uncertain) parts of the trend alone, only trading the strongest segments.
System Objectives
The challenge is to bring the above considerations together in a cohesive set of realistic objectives:
- If you are only prepared to tolerate a 10 per cent retracement, do not try to ride out major corrections.
- If you are prepared to tolerate a 10 or 20 per cent retracement, consider trading lower-risk blue chip stocks in the hope of limiting the number of times that you are stopped out in a trend. Or are you prepared to endure more stop-outs in the hope of greater returns from faster-moving stocks?
- If your transaction costs are high, you will need to limit the number of times that you are stopped out in the trend. Are you prepared to tolerate deep retracements or will you trade more reliable, slower-moving stocks?
- If you intend to trade a shorter time frame, you will need to minimize your transaction costs.
- How will you identify suitable trends, separating faster-moving and slower-moving stocks?
- How much of the early part of the trend do you need to sacrifice in order to minimize false starts? This is especially important if you are going to trade more volatile stocks.
- How will you identify and cope with shake-outs: where there are two (or even three) successive down-swings before the up-trend resumes?
- How will you cope emotionally if you are repeatedly stopped out? Will you have the resolve to stick to your system?
- How will you identify and cope with blow-offs, where price goes into an almost vertical spike? These tend to reverse sharply, leaving trend-following exits far behind.
- If you trade breakouts, how will you cope with false breaks or fake-outs?
Examples
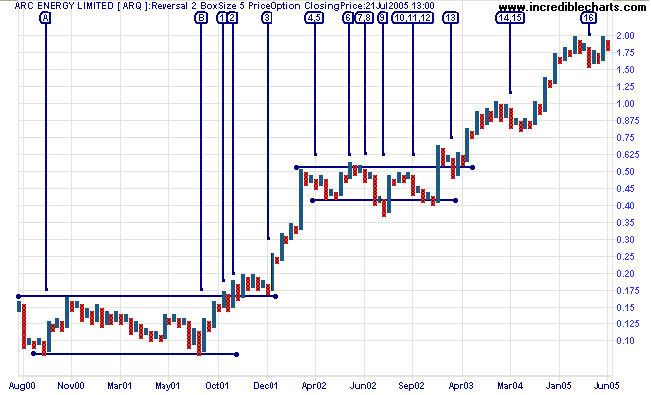
Using the same Arc Energy as earlier, here is an example of a long-term system that may be used by a trader with high transaction costs and who is prepared to tolerate fairly deep (20%) retracements. Again, I have used point and figure charts because they are less subjective. Box size is 10 with reversal amount of 2.
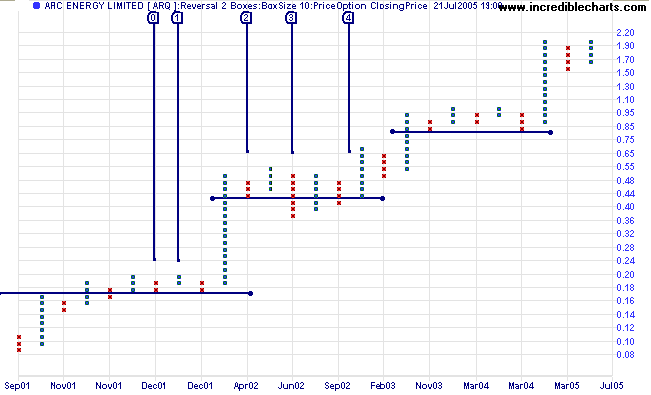
- Entry is made at 20 cents on the start of a new column [1] after the pull-back respected support at [0].
- Exit would have been made in column [2] if the retracement had continued to 40 cents (20%).
- Stopped out at 42 cents when the retracement [3] falls below the previous low [2].
- Re-enter at 46 cents on the start of a new column after the higher low [4].
An alternative approach, that could be employed by a trader with lower transaction costs and possibly a lower tolerance for retracements. Box size is 5 with reversal amount of 2.
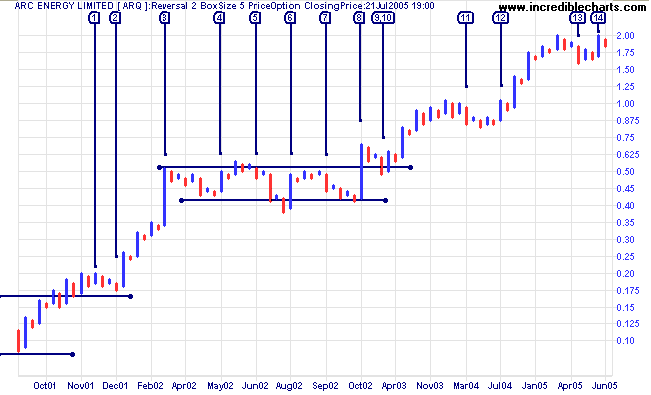
- Entry at 19 cents on start of a new column after the pull-back respects support.
- Stopped out at 17.5 cents.
Re-enter at 18.5 cents on completion of false break. - Exit at 49 cents, immediately after "long pole" (or
"flagpole") with more than 10 boxes above the previous up-swing.
Flagpoles are one method of identifying market spikes or "blow-offs". - Re-enter at 45 cents after double bottom.
- Stopped out on lower low at 49 cents.
- Re-enter at 44 cents on new high (above previous up-swing).
- Stopped out on lower low at 47 cents.
- Re-enter at 45 cents precedes another possible flagpole (ignored here).
- Stopped out at 55 cents. Another shake-out.
- Re-enter at 65 cents on higher high.
- Another shake-out at 87.5
- Re-enter at 90 after higher low.
- Stopped at 175 cents after higher low.
- Re-enter at 175 cents.
Gross trading profits are almost identical at 178.5 cents compared to 176 cents for the earlier example. But when we factor in transaction costs and slippage (at a combined 0.75% per trade) the last example falls to 169.5, because of the higher number of transactions, while the earlier example falls only slightly to 173.5 cents. As you can see, there is not much between the two approaches. And the example chosen, with a fast trend, few strong corrections and many attempted shake-outs, may flatter the first approach over the latter.
What the above examples do illustrate, though, is that, provided we are able to identify fast-moving trends, transaction costs are secondary, relative to overall system performance.
Summary
Trend traders face three major obstacles: false starts (or whipsaws), frequent shake-outs and late exits. Frequent shake-outs can present a problem even with the strongest trends. Your system should consider the time frame that you are trading; your transaction costs; your ability to endure frequent stops; and your tolerance for strong corrections. Finally, you need to decide whether you are going to trade fast-moving, highly volatile stocks (with greater risk) or slower, steadier blue chips.
In the weeks ahead I hope to answer more of the questions posed under Design Objectives (above) and compare the performance of several different trend filters and exit strategies.

Author: Colin Twiggs is a former investment banker with almost 40 years of experience in financial markets. He co-founded Incredible Charts and writes the popular Trading Diary and Patient Investor newsletters.
Using a top-down approach, Colin identifies key macro trends in the global economy before evaluating selected opportunities using a combination of fundamental and technical analysis.
Focusing on interest rates and financial market liquidity as primary drivers of the economic cycle, he warned of the 2008/2009 and 2020 bear markets well ahead of actual events.
He founded PVT Capital (AFSL No. 546090) in May 2023, which offers investment strategy and advice to wholesale clients.