MACD Histogram
The MACD Histogram is more suited to traders than investors: signals are generated a lot earlier in the trend but are less reliable as a consequence. It is essential that stop losses are employed on every trade and adjusted over time to protect profits.
Set up the MACD so that the first moving average is half the length of the cycle being tracked. The second moving average should be half the length of the first and the third (signal line) moving average can be varied according to the sensitivity required.
Dr Alexander Elder, in Trading for a Living, uses an MACD Histogram as the first screen in his Triple Screen Trading system. Weekly moving averages are used, set at 26, 12 and 9 weeks. Weekly MACD readings are more reliable but there is a lag effect (signals only occur once a week). Alternatively, use an equivalent daily MACD (e.g. 130 days, 60 days and 45 days) with a filter (e.g. 3 consecutive bars) or a signal line created with Indicator Smoothing.
Example
FedEx is shown with 150-day exponential moving average and MACD Histogram (100-day, 50-day and 30-day moving averages) and 9-day exponential signal line ( optional indicator smoothing).

- The histogram crosses to above the signal line at [1], signaling that the market can now be traded long.
- Conditions remain favorable until [8], when the histogram crosses to below the signal line. Place a sell-stop below the Low of the signal day. We are stopped out the next day.
Entry is timed using a short-term oscillator and trailing buy and sell stops:
FedEx is shown below with 150-day exponential moving average and 9-day Stochastic %K and %D.
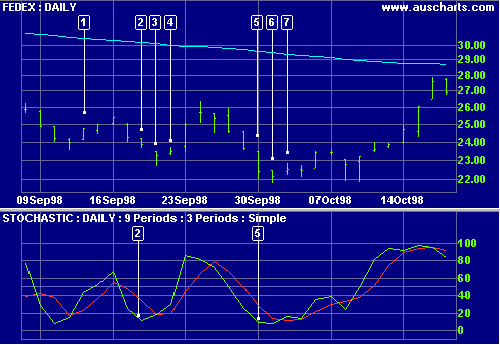
- The MACD histogram signals [1] that conditions are favorable for long trades.
- %K crosses below the oversold level at [2]. Place a buy-stop above the day's High.
- The stop is not activated and the day has a lower High. Move the buy-stop to just above the High.
- Price moves up stopping us in. Place a stop loss below the Low of day [3].
- We are stopped out when price falls below the stop level on day [5]. The same day provides us with a signal to go long - place a buy-stop above the High of day [5].
- Price moves lower - move the buy-stop down to above the High on day [6].
- Price moves higher, stopping us in. Place a stop loss below the Low of day [6].
- The long position is closed when MACD histogram closes below the signal line at [8] - refer to the first chart. Place a sell-stop below the Low of the signal day. We are stopped out the next day.

Author: Colin Twiggs is a former investment banker with almost 40 years of experience in financial markets. He co-founded Incredible Charts and writes the popular Trading Diary and Patient Investor newsletters.
Using a top-down approach, Colin identifies key macro trends in the global economy before evaluating selected opportunities using a combination of fundamental and technical analysis.
Focusing on interest rates and financial market liquidity as primary drivers of the economic cycle, he warned of the 2008/2009 and 2020 bear markets well ahead of actual events.
He founded PVT Capital (AFSL No. 546090) in May 2023, which offers investment strategy and advice to wholesale clients.