Link for this issue: https://tradingdiary.incrediblecharts.com/2025-08-04-markets-gold-economy.php
Weak labor report hammers stocks
Key Points
- The S&P 500 and Dow fell sharply on the poor July jobs report
- Financial markets warn of easy credit conditions, which could lead to markets mispricing risk
- Real GDP growth is misleading due to the buildup of inventories in Q1, ahead of tariffs, and their subsequent rundown in Q2
- Long-term Treasury yields fell, and the dollar weakened, anticipating lower interest rates, with the fall boosting gold demand
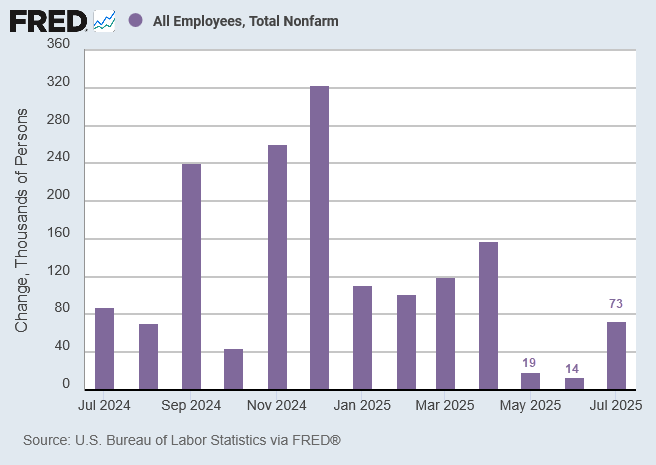
July payrolls increased by 73K, below the estimate of 104K, but big downward revisions to the previous two months spooked investors. A combined revision of -258K to May and June employment lowered job gains to 19K and 14K, respectively.
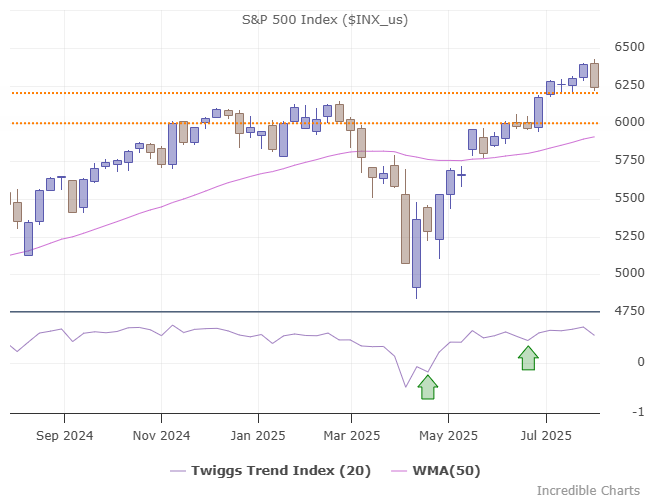
Stocks were hammered, with the S&P 500 displaying a bearish engulfing on the weekly chart. Breach of support at 6200 would signal a correction to test 6000.
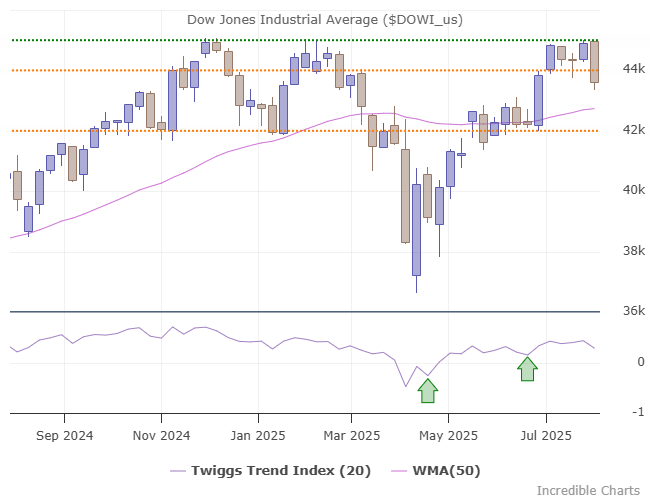
The Dow Jones Industrial Average failed to confirm the S&P 500 bull market signal and has now broken support at 44K, warning of a correction to 42 K.
Financial Markets
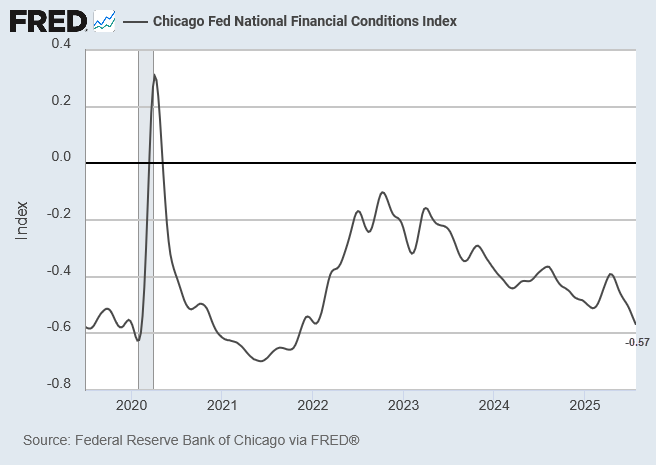
The Chicago Fed National Financial Conditions Index warns of further easing with a fall to -0.57, signaling loose monetary conditions similar to 2021 during the COVID pandemic.
During the week, we highlighted the risk of a credit bubble if super-easy financial conditions persist:
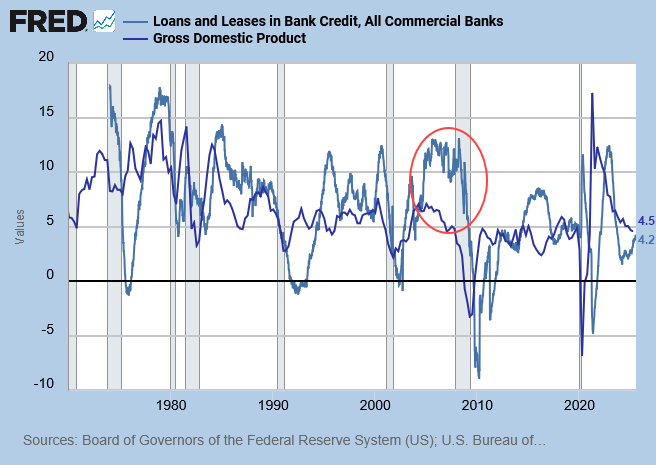
Looser monetary policy would accelerate credit growth (light blue) above the nominal GDP rate (dark blue), leading to malinvestment as in the credit bubble preceding the 2008 global financial crisis. Mispricing risk feeds instability, leading to an inevitable collapse when assets reprice.
Bond market guru Jim Grant today confirmed the worrying speculative bonanza:
It’s a speculative-credit bonanza. Freewheeling conditions in the primary market pushed leveraged loan activity to new heights in July, with domestic new issuance reaching $223.2 billion. That’s the largest one-month total on record, comfortably topping the prior $206 billion peak established in January. One instructive development: Feverish demand helped software firm Datasite International price two loans in less than a month to fund a pair of acquisitions, with pricing on the second deal on July 23 matching the first even after Moody’s Analytics downgraded the firm to B3 from B2 (equivalent to single-B-minus from single-B) during the interim, dubbing its roll-up strategy “more aggressive than anticipated.” Within the high-yield bond category, supply clocked in at $35 billion, the busiest July since at least 2006. Last month, the triple-C-rated portion of Bloomberg’s junk bond gauge posted a meaty 1.47% return, compared to sub 0.5% advances for the single- and double-B-rated categories. “I haven’t seen a market quite like this post the Great Financial Crisis,” Jon Poglitsch, managing director at Sycamore Tree Capital Partners, marveled to Bloomberg Wednesday. There’s a “grab for spread where anyone can find it,” he noted.
Treasury Markets
The weak jobs report swept aside concerns over the uptick in June core PCE inflation to 2.8%.

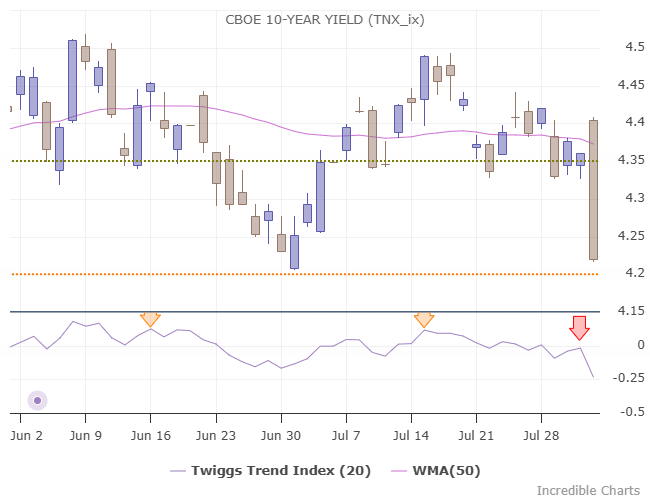
10-year Treasury yields plunged, anticipating Fed rate cuts, testing long-term support at 4.2%.
Economy
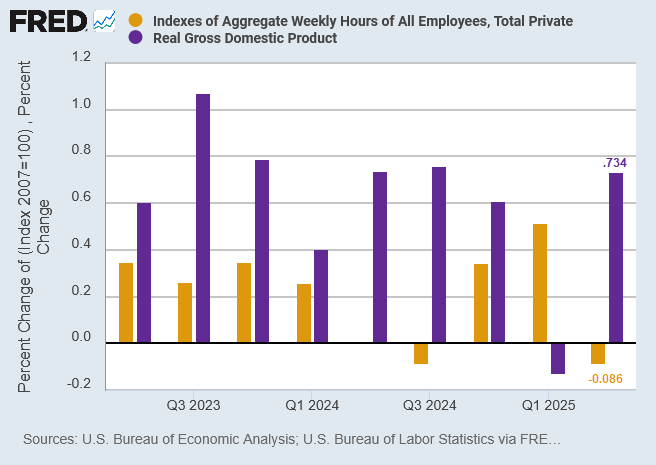
Real GDP growth recovered to an annualized rate of 2.9% in Q2, but the numbers are misleading. The biggest contributor was a sharp reduction in inventories after massive Q1 pre-orders, front-running the tariffs announced by President Trump in April. The contraction in Q2 aggregate hours worked reveals a far gloomier picture.
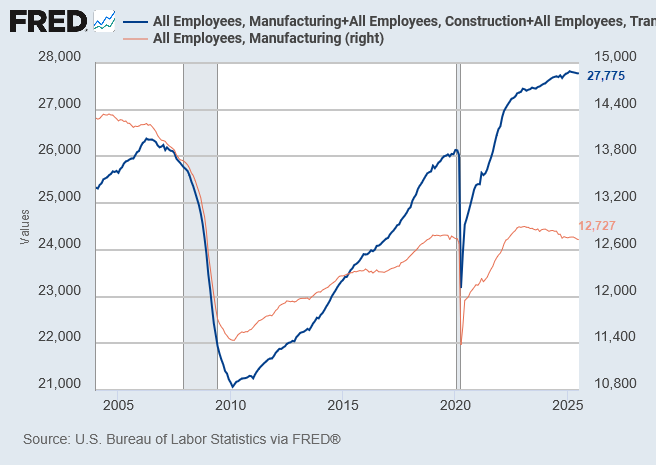
A 50K July decline in employment in cyclical sectors — manufacturing, construction, transportation, and warehousing — warns that the economy is slowing.
Labor Market
Job openings and unemployment remain in balance, as highlighted by Chair Powell at this week's FOMC announcement.
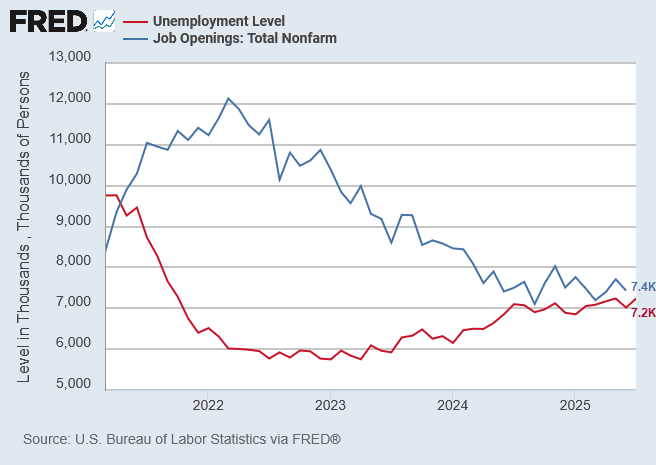
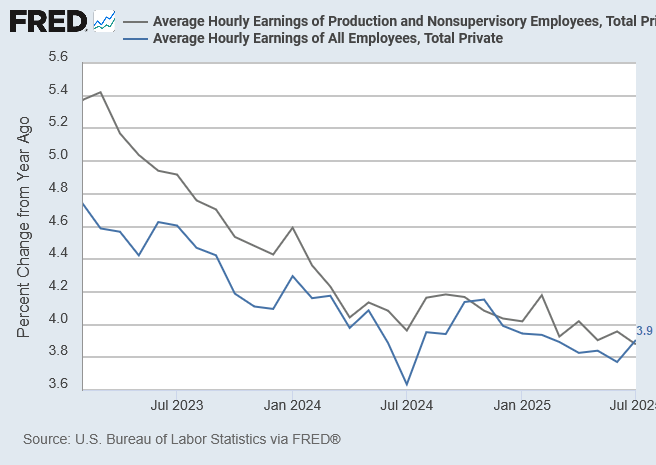
Annual growth in average hourly earnings at 3.9% reflects reasonable labor demand.
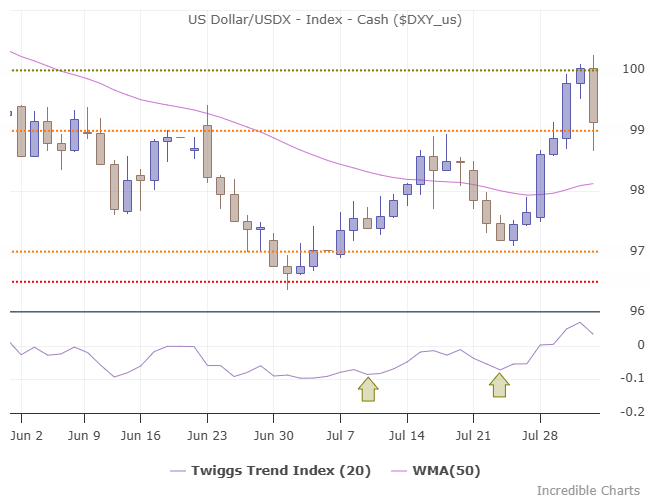
Dollar & Gold
The US Dollar Index fell sharply on the July jobs report, anticipating lower interest rates ahead.
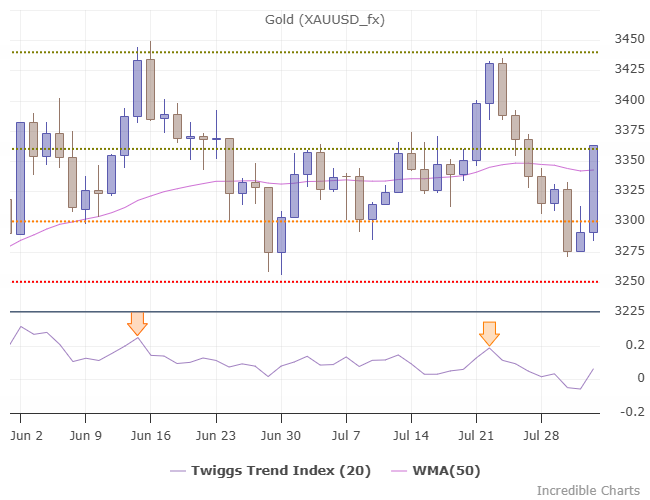
The fall boosted demand for gold, which is testing resistance at $3,360 per ounce. Breakout would signal a test of $3,440.
Conclusion
A weak jobs report, with falling employment in cyclical sectors, warns that the economy is slowing. Stocks are expected to undergo a correction, with the S&P 500 testing support at 6000 and the Dow testing 42K.
Interest rates are expected to fall, with the Fed cutting rates to create a soft landing. Lower interest rate expectations have also weakened the dollar and boosted demand for gold.
Easy credit conditions increase the risk of a credit bubble, which could lead to investors mispricing risk.
We are underweight stocks except for defensive sectors, and overweight cash, gold, and short-term financial assets.
Acknowledgments
- Federal Reserve of St Louis: FRED Data
- Peter Boockvar: Jobs Rundown
- Grant's Daily: Bold Rush
- Adam Taggart: "Strong" Q2 GDP Growth Not As Robust As It Sounds?
Market Analysis Subscribers
Recent titles: US Weekly Market Indicators ASX Weekly Market Indicators Fed stands firm, so does BOJ Crude jumps on sanctions fears
Everything contained in this email, related websites, training videos and training courses (collectively referred to as the "Material") has been written for the purpose of teaching analysis, trading and investment techniques. The Material neither purports to be, nor is it intended to be, advice to trade or to invest in any financial instrument, or class of financial instruments, or to use any particular methods of trading or investing.
Advice in the Material is provided for the general information of readers and viewers (collectively referred to as "Readers") and does not have regard to any particular person's investment objectives, financial situation or needs. Accordingly, no Reader should act on the basis of any information in the Material without properly considering its applicability to their financial circumstances. If not properly qualified to do this for themselves, Readers should seek professional advice.
Investing and trading involves risk of loss. Past results are not necessarily indicative of future results.
You, the Reader, need to conduct your own research and decide whether to invest or trade. The decision is yours alone. We expressly disavow all and any liability to any person, with respect of anything, and of the consequences of anything, done or omitted to be done by any such person in reliance upon the whole or any part of the Material.

Author: Colin Twiggs is a former investment banker with almost 40 years of experience in financial markets. He co-founded Incredible Charts and writes the popular Trading Diary and Patient Investor newsletters.
Using a top-down approach, Colin identifies key macro trends in the global economy before evaluating selected opportunities using a combination of fundamental and technical analysis.
Focusing on interest rates and financial market liquidity as primary drivers of the economic cycle, he warned of the 2008/2009 and 2020 bear markets well ahead of actual events.
He founded PVT Capital (AFSL No. 546090) in May 2023, which offers investment strategy and advice to wholesale clients.