Volatility Ratio (Schwager)
This ratio is similar to one used by Jack Schwager in Technical Analysis to identify wide-ranging days.
Example
Microsoft Corporation with 14-day Volatility Ratio (VR).
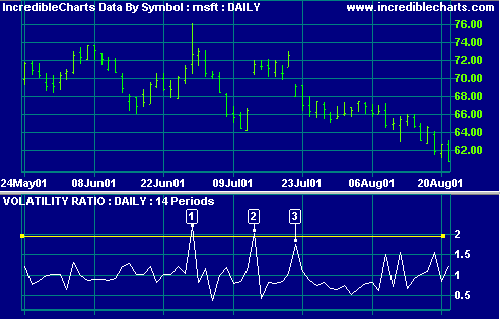
Mouse over chart captions to display trading signals.
Wide ranging days are signaled by a Volatility Ratio greater than 2.0
- A wide-ranging day signals a likely reversal.
- Price gaps sharply upward.
- A downward gap signals the completion of an island cluster reversal, formed by [2] and [3].
Setup
The default period for Volatility Ratio is 14 days. To alter the default settings - Edit Indicator Settings.
See Indicator Panel for directions on how to set up the indicator.
Formula
Volatility Ratio = True Range / EMA of True Range for the past n periods
EMA = exponential moving average
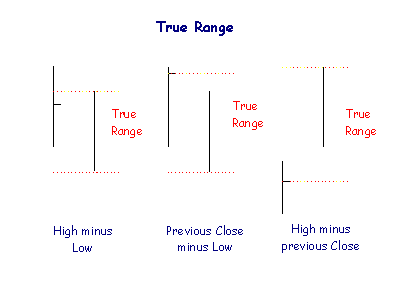
True Range is the greater of:
- The day's High minus the Low;
- Today's High minus yesterday's Close; and
- Yesterday's Close minus today's Low.

Author: Colin Twiggs is a former investment banker with almost 40 years of experience in financial markets. He co-founded Incredible Charts and writes the popular Trading Diary and Patient Investor newsletters.
Using a top-down approach, Colin identifies key macro trends in the global economy before evaluating selected opportunities using a combination of fundamental and technical analysis.
Focusing on interest rates and financial market liquidity as primary drivers of the economic cycle, he warned of the 2008/2009 and 2020 bear markets well ahead of actual events.
He founded PVT Capital (AFSL No. 546090) in May 2023, which offers investment strategy and advice to wholesale clients.