Average True Range (ATR) Indicator
Average True Range is a volatility indicator from J. Welles Wilder that measures commitment by comparing the range for each successive day. Expanding and contracting ranges signal eagerness in a trending market.
Details of the formula can be found at Average True Range Formula.
Please note that Wilder does not use the standard moving average formula and the time period may need adjustment.
Trading Signals
Average True Range offers two basic signals:
- High values warn of market tops and bottoms
- Low values indicate ranging markets.
Example
Microsoft Corporation with 14 day exponential moving average of Average True Range.
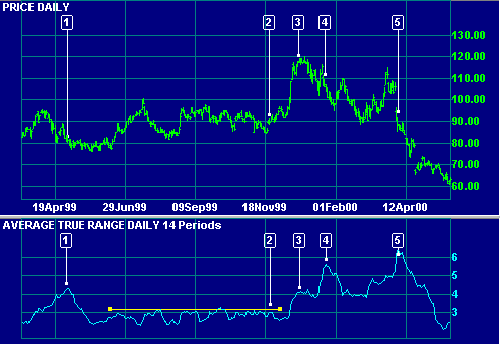
Mouse over chart captions to display trading signals.
- The Average True Range indicator peaks before price bottoms.
- Low Average True Range readings - the market is ranging.
- Average True Range peaks before the market top.
- Average True Range peaks after a secondary rally.
- Average True Range peaks during the early stages of a major price fall.
Setup
The default Average True Range indicator window is 14 days. To alter the default settings - Edit Indicator Settings.
See Indicator Panel for directions on how to set up an indicator.
Average True Range Formula
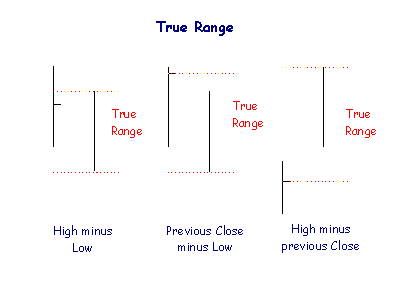
True Range is calculated as the greater of:
- High for the period less the Low for the period.
- High for the period less the Close for the previous period.
- Close for the previous period and the Low for the current period.
Basically, the Close for the previous period is substituted for the current Low, if lower, or for the current High, if higher.
Average True Range is typically a 14 day exponential moving average* of True Range.
*Welles Wilder's Indicators
Users should beware, when setting time periods for Welles Wilder's indicators, that he does not use the standard exponential moving average formula. See
We recommend that users try shorter time periods when using one of the above indicators. For example, if you are tracking a 30-day cycle you would normally select a 15-day Indicator Time Period. With the ATR, adjust the time period as follows:
ATR time period = (n + 1) / 2 = (15 + 1) / 2 = 8 days

Author: Colin Twiggs is a former investment banker with almost 40 years of experience in financial markets. He co-founded Incredible Charts and writes the popular Trading Diary and Patient Investor newsletters.
Using a top-down approach, Colin identifies key macro trends in the global economy before evaluating selected opportunities using a combination of fundamental and technical analysis.
Focusing on interest rates and financial market liquidity as primary drivers of the economic cycle, he warned of the 2008/2009 and 2020 bear markets well ahead of actual events.
He founded PVT Capital (AFSL No. 546090) in May 2023, which offers investment strategy and advice to wholesale clients.