Incredible Charts now in your browser...
Improve your trading performance with amazing insights from stock charts featuring proprietary indicators and powerful stock screens.
Why Incredible Charts?
Features include:
- ASX, NYSE, NASDAQ, OTC Markets, LSE and TSX stock exchange data
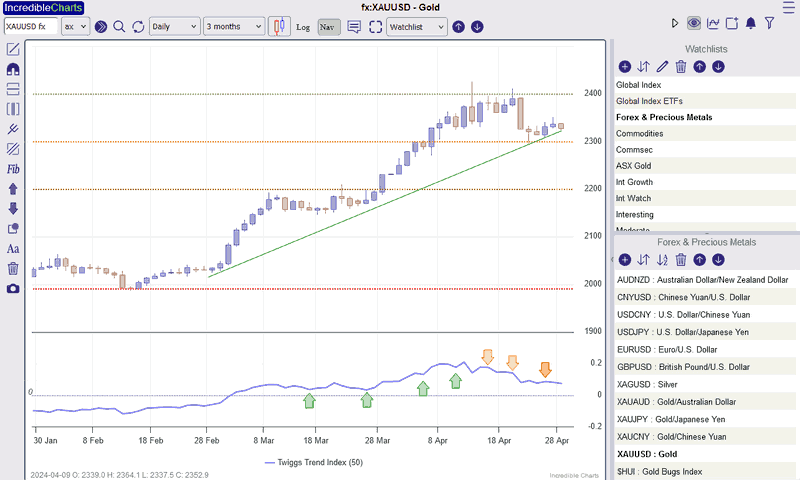
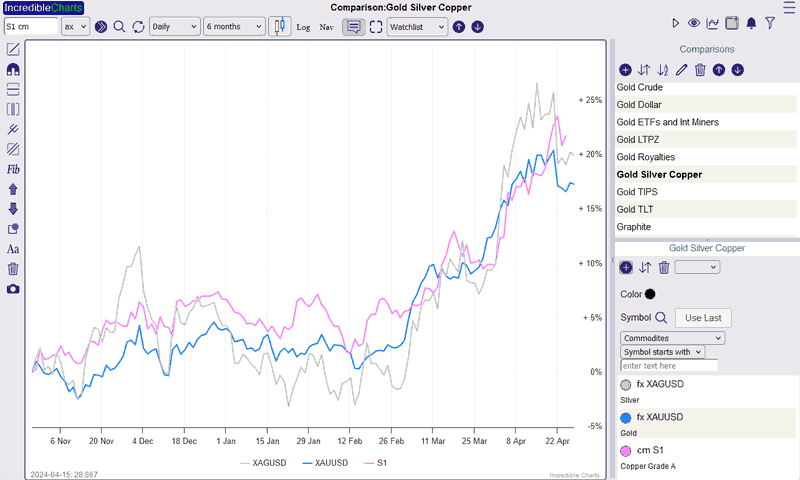
- Forex & precious metals
- Premium data, adjusted for corporate actions that distort indicator signals.
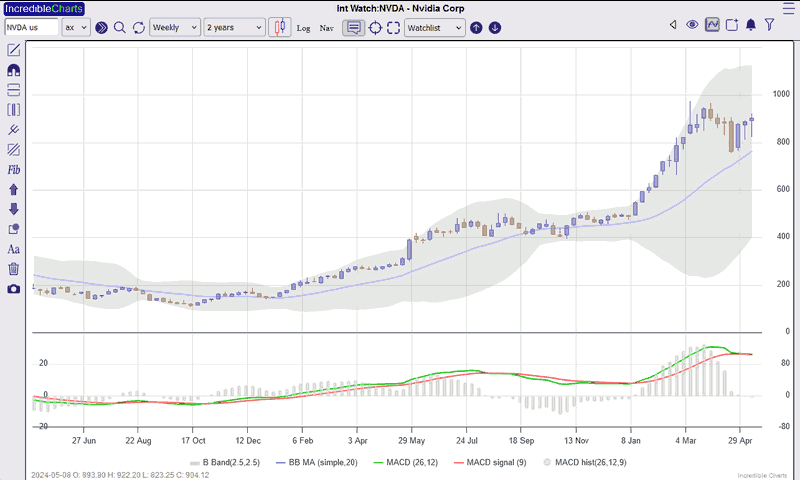
- More than 100 technical indicators, including:
- Proprietary Twiggs® Money Flow, Trend Index and Twiggs® Momentum
- Stop-loss systems: ATR Trailing Stops, Parabolic SAR, Chandelier Exits, Safezone and Volatility Stops
- Auto-fit trendlines and channels
- Powerful stock screens with a wide array of technical filters
Classic Stock Charts - Download for Windows
Incredible Charts classic desktop charting package:
- Compatible with Windows Operating Systems
- Download and install on your PC

Technical Education
About: Incredible Charts
Incredible Charts was founded in 1996 when a need for a low-cost charting for the stock market was identified by the founders.
The website launched in 2001, offering free charting software, end-of-day data and education.
The Premium Data Service was introduced in 2003, with coverage expanding to include the ASX, LSE, NYSE, Nasdaq, OTC Markets, TSX, TSX-V, Forex and Precious Metals and data histories adjusted for dilutions.
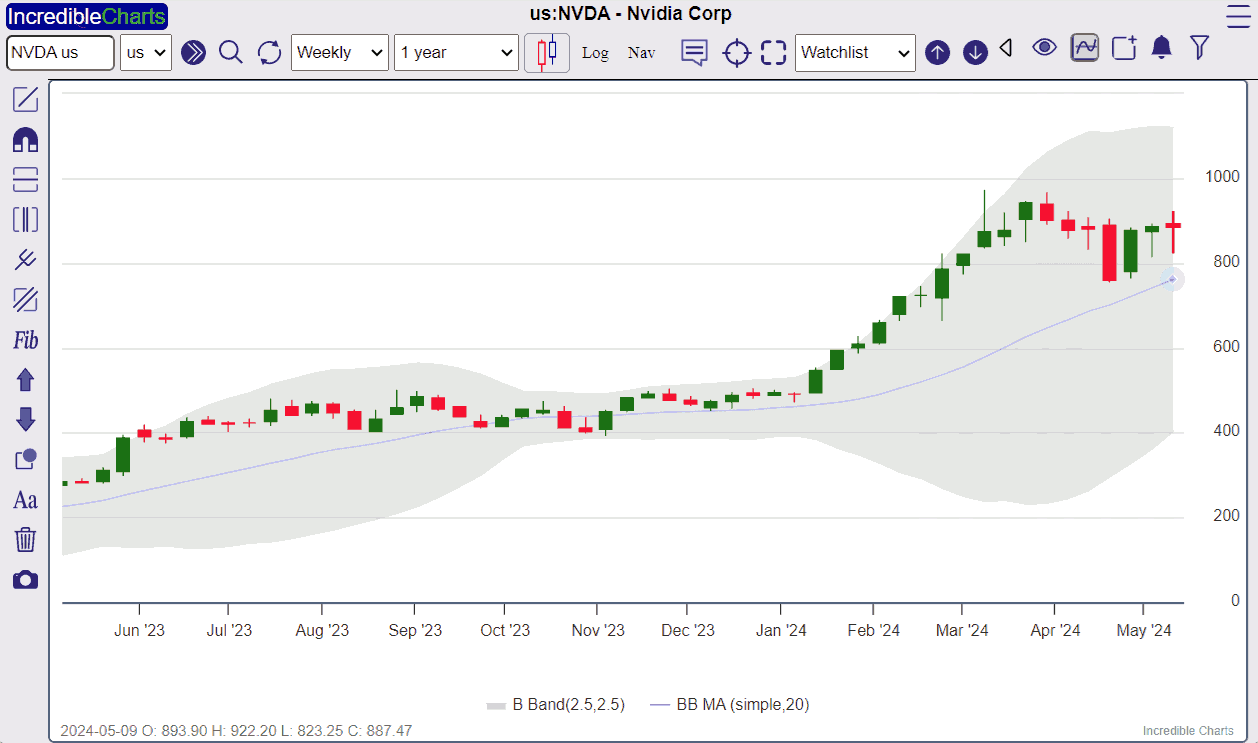
In 2024 Incredible Charts released Indigo, an HTML5 version for browser. Modernizing the charts and making it compatible with Windows, MacOS and Linux.
Indicators
Technical indicators highlight a particular aspect of price or volume behavior on a stock chart to provide valuable insights and help with analysis.
Newcomers often great significance to the favorite indicators but none are infallible.
Keep it simple and select indicators that complement each other and are suited to current market conditions.
Popular Indicators
Types of Indicators
Trading Diary
Colin Twiggs and his team provide free monthly updates on financial markets and the economy.
Join 120,000 followers in receiving coverage on:
- Market Outlook and Global Macro-Trends
- Trading Ideas
- New Developments
About: Colin Twiggs
Colin has almost 40 years experience in finance and investment. Having qualified as a chartered accountant at KPMG, he joined trust company Metboard before going on to join international investment bank Investec in South Africa. At Investec he filled senior roles in finance, property and investment banking. In 1998 he moved to Australia to to concentrate full-time on trading and investment.
He co-founded Incredible Charts in 1996 and writes the popular Trading Diary newsletter. His specialty is blending fundamental analysis of the global economy with both fundamental and technical analysis of stocks and securities.
